Machine Learning Trading
Udacity Quizzes
41 minute read
Notice a tyop typo? Please submit an issue or open a PR.
Udacity Quizzes - ML4T
Reading and Plotting Stock Data
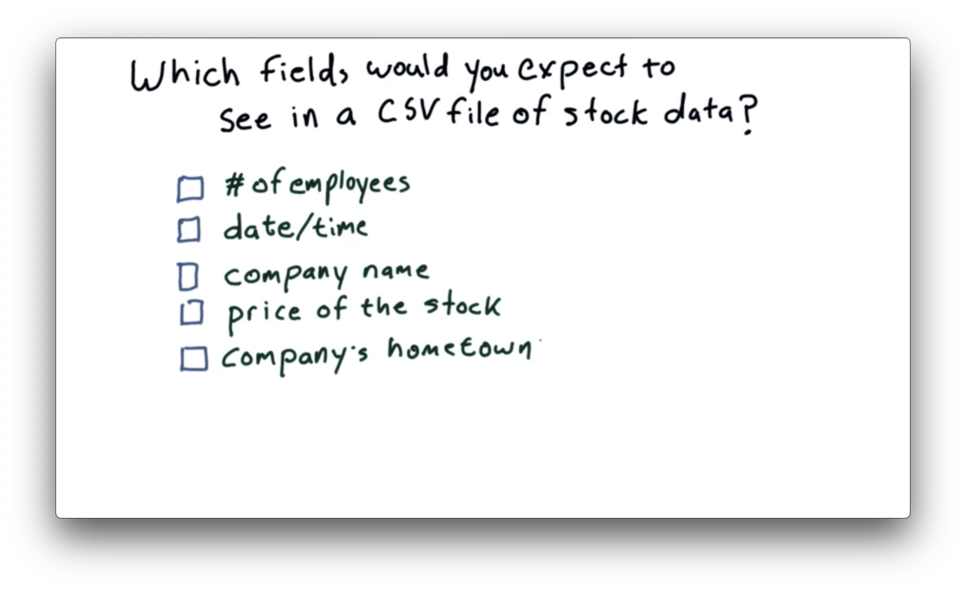
Which Fields Should Be In A CSV File Quiz
Which Fields Should Be In A CSV File Quiz Solution
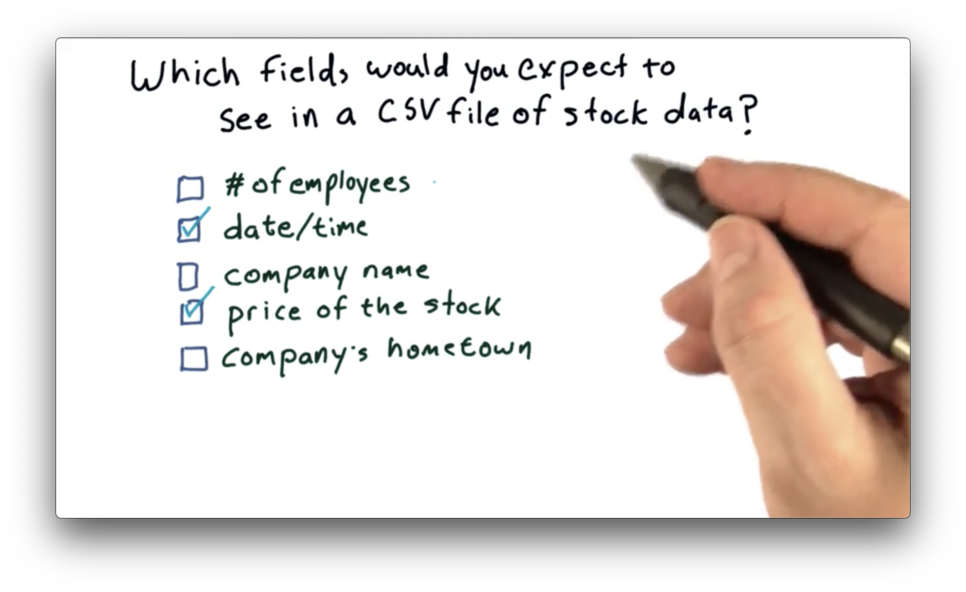
We want to include data that changes frequently; otherwise, we are wasting space including redundant data. Of the options given, both "date/time" and "price of the stock" are good fits. The other data points are either static or change relatively infrequently.
Compute Mean Volume Quiz
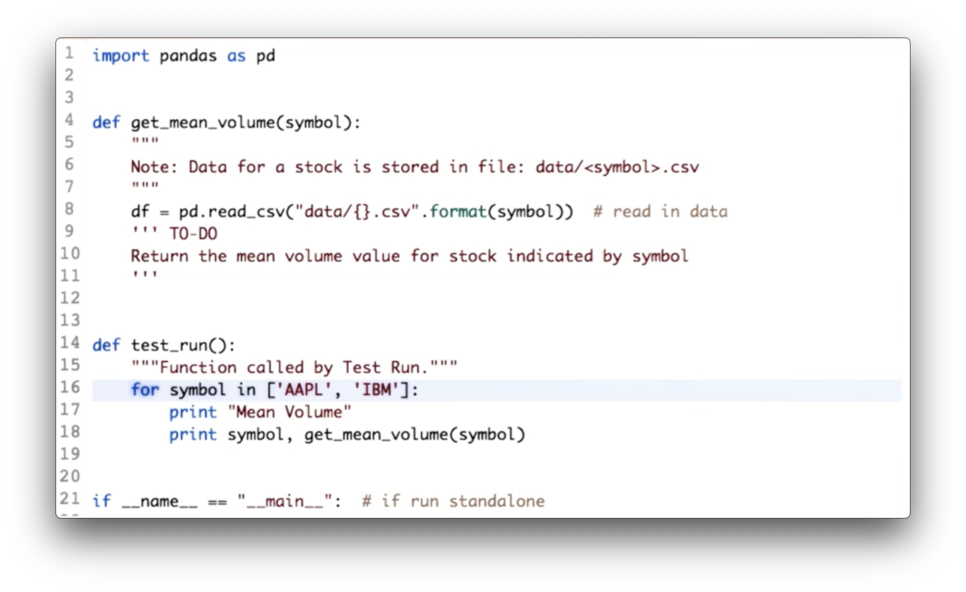
Your task is to calculate the mean volume for each of the given symbols.
Compute Mean Volume Quiz Solution
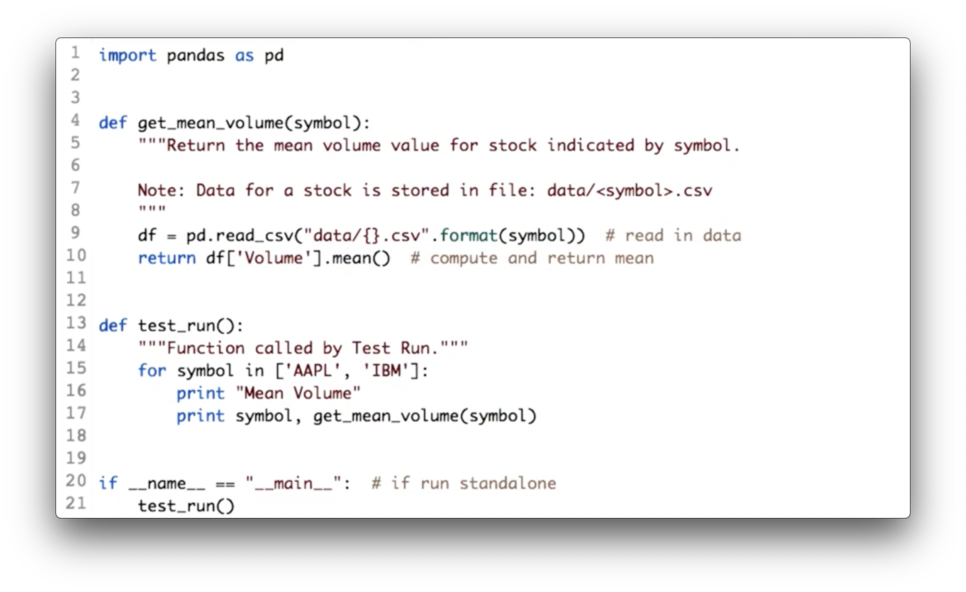
Given a DataFrame df containing a "Volume" column, the following code returns the mean of the values in that column.
df['Values'].mean()Documentation
Plot High Prices for IBM Quiz
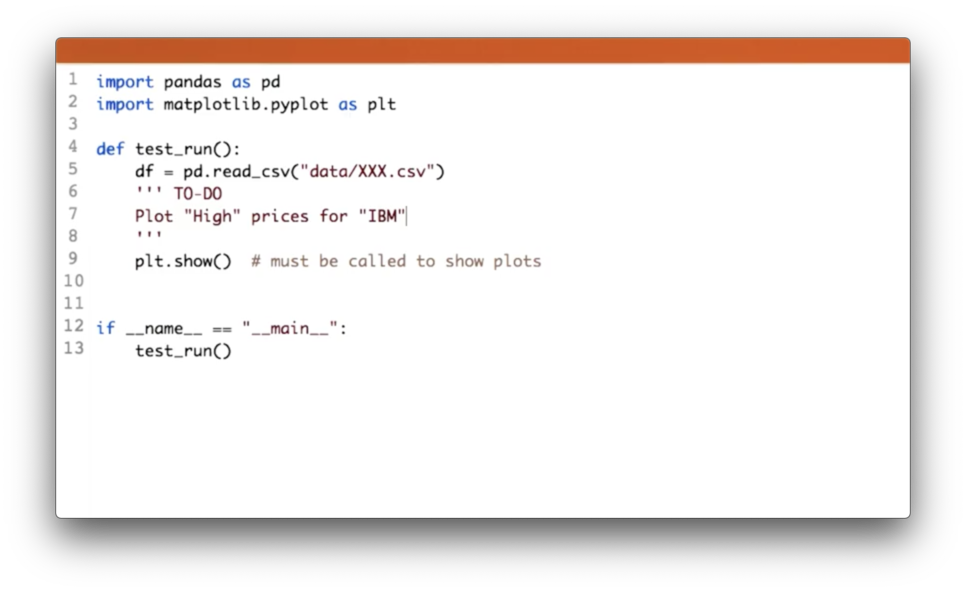
Your task is to plot the high prices for IBM.
Plot High Prices for IBM Quiz Solution
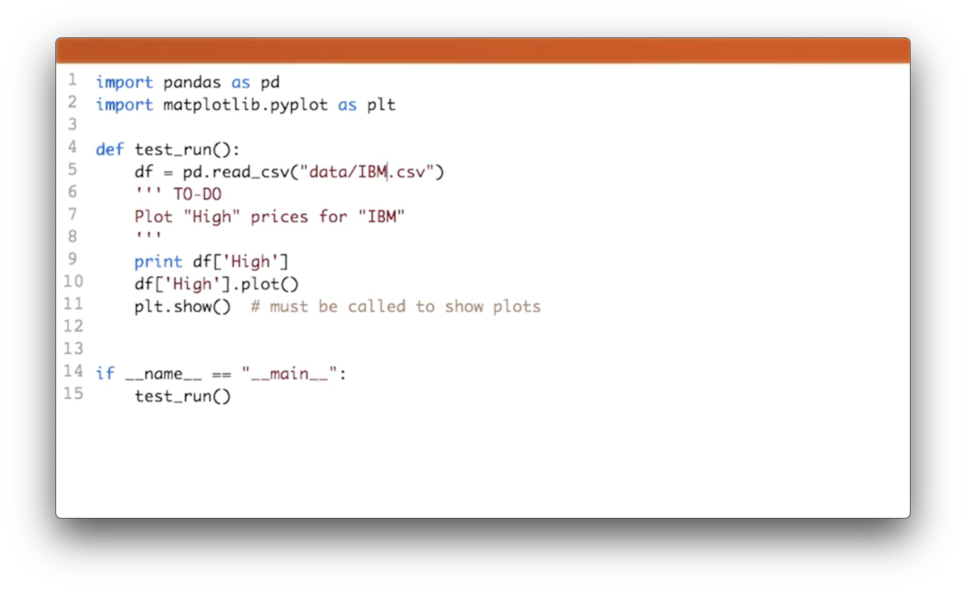
First, we need to make sure that we read in the right CSV, which we can accomplish with:
df = pd.read_csv('data/IBM.csv')Next, we can retrieve the "High" column and plot it:
df['High'].plot()Working With Multiple Stocks
NYSE Trading Days Quiz
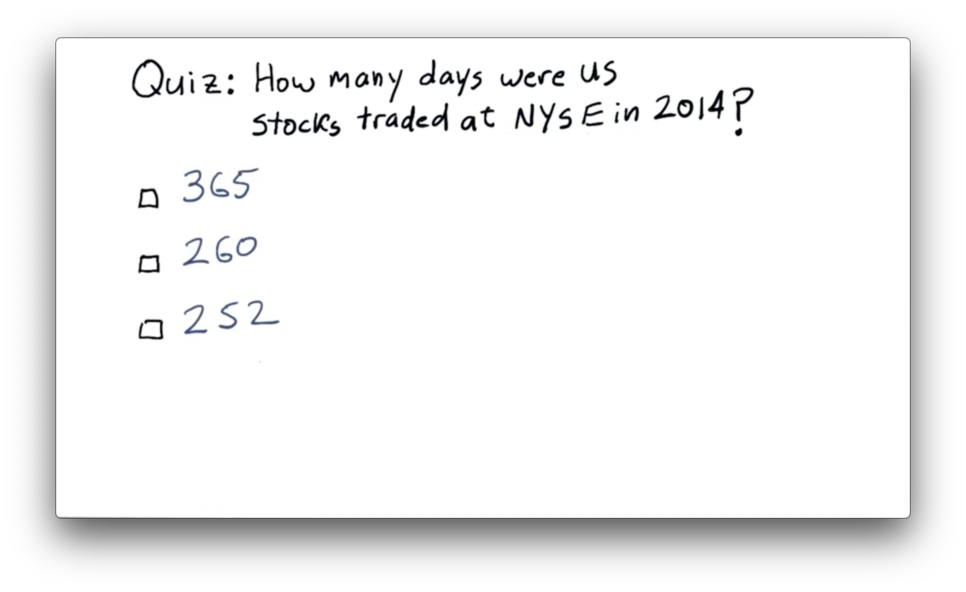
NYSE Trading Days Quiz Solution
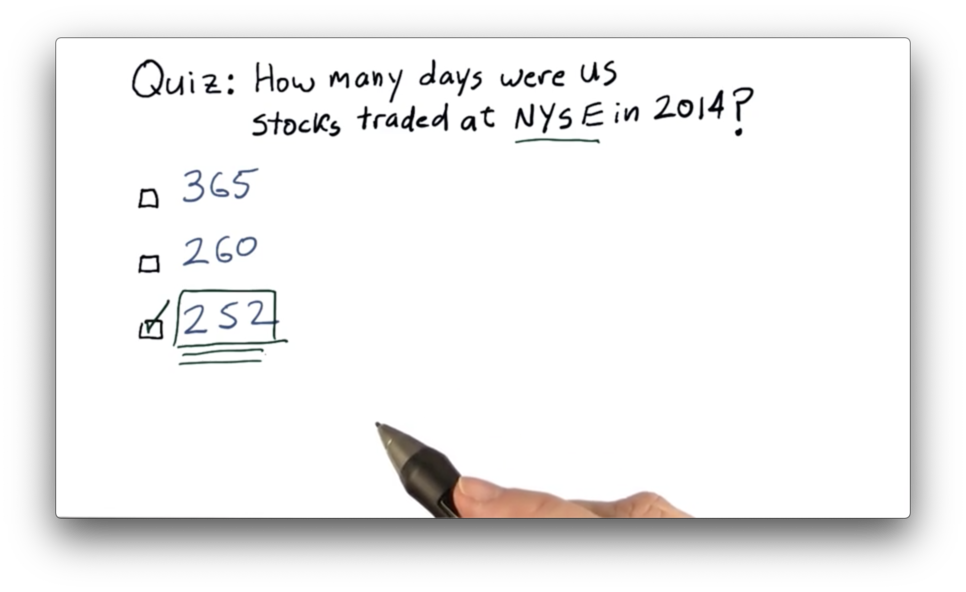
See the breakdown here (for 2018 and 2019).
Types of Joins Quiz
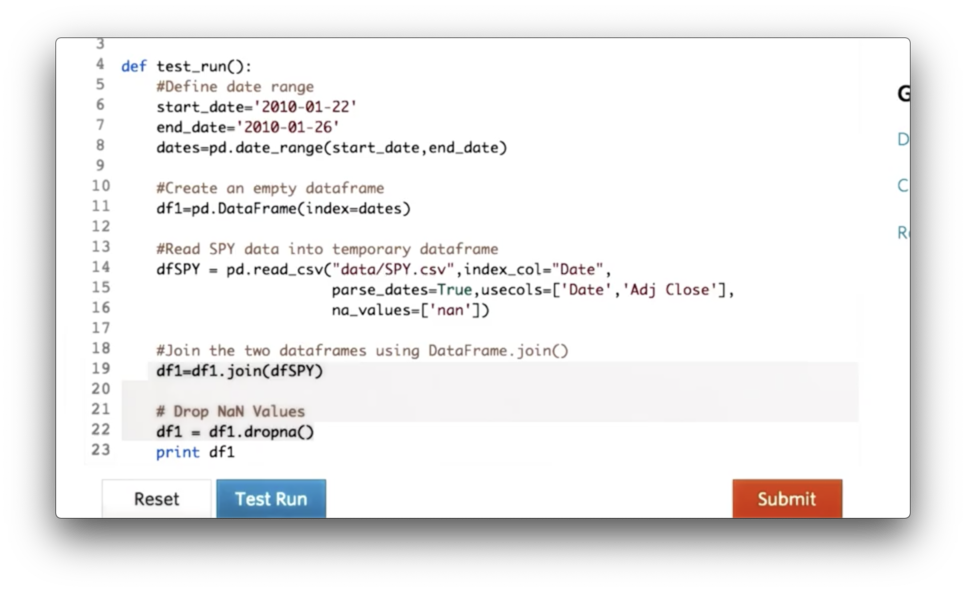
We can avoid having to explicitly call dropna on line 22 by passing a certain value for the 'how' parameter of the join call on line 19.
What is the value of that parameter?
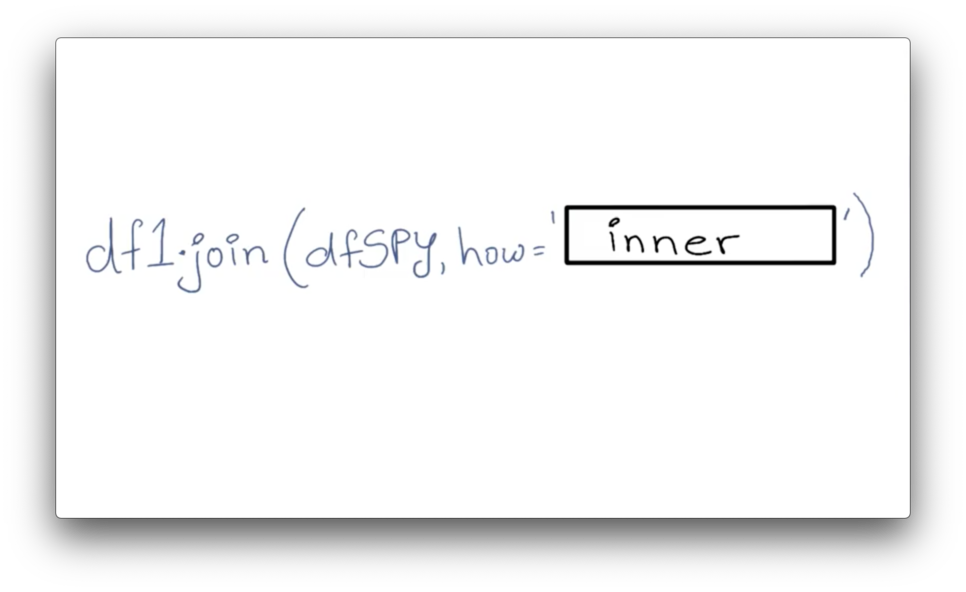
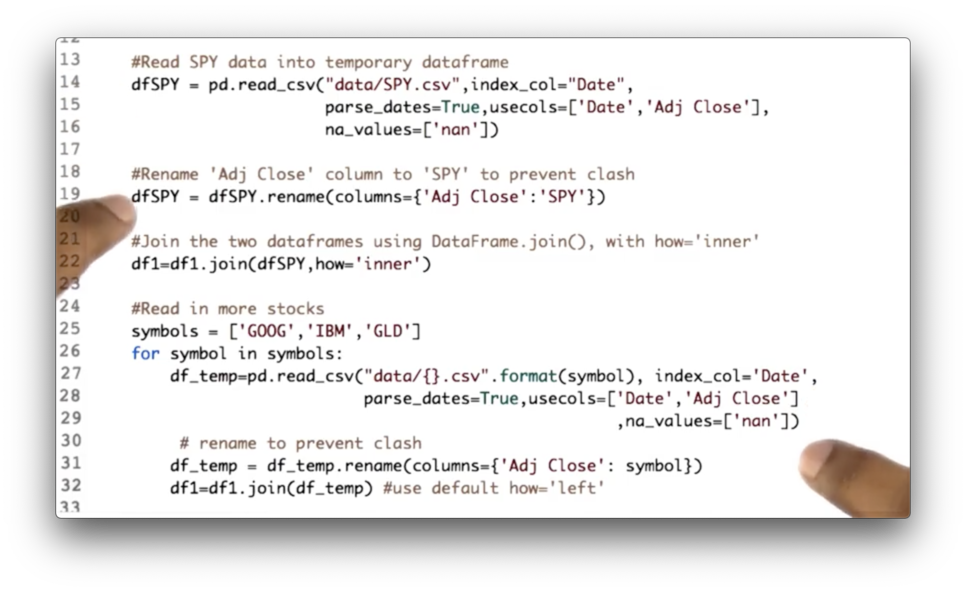
Types of Joins Quiz Solution
Documentation
Utility Functions for Reading Data Quiz
If we look at the code we have written so far, we see some duplication.
Your task is to consolidate this code into one location: the utility function get_data.
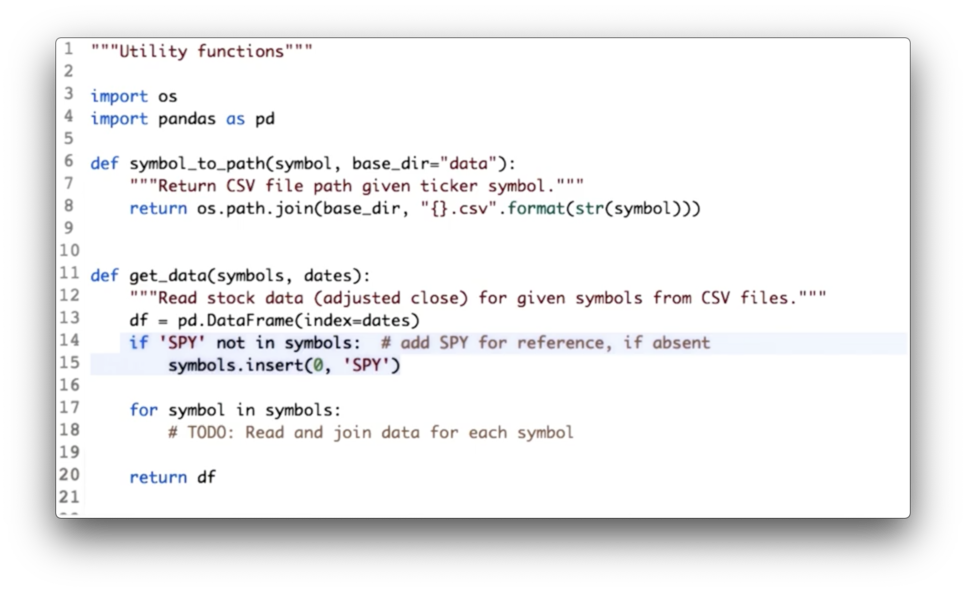
Utility Functions for Reading Data Quiz Solution
We have consolidated both the DataFrame initialization code and the joining code.
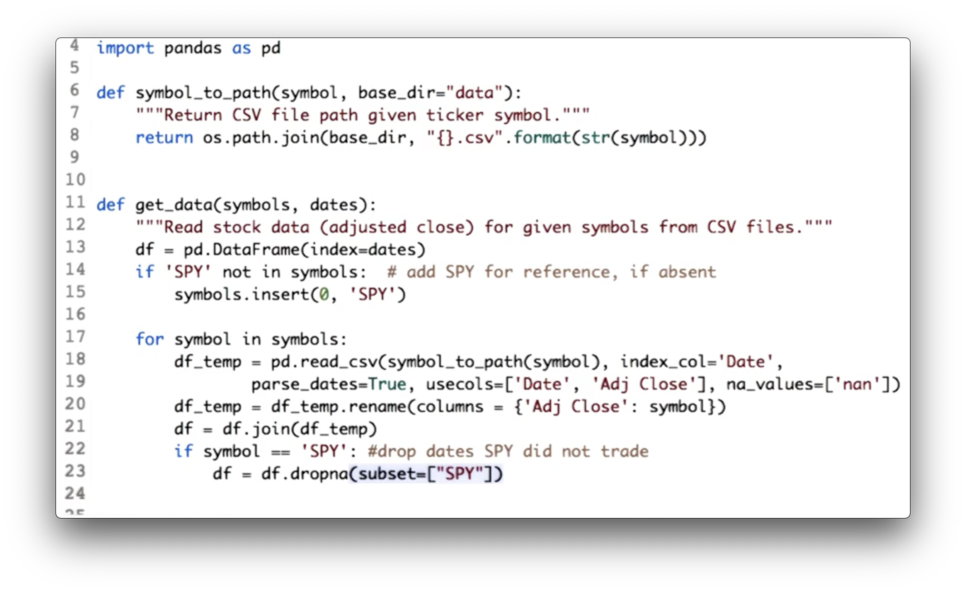
Additionally, since we are using SPY as our baseline, we drop all rows from df where SPY has not traded - that is, where the SPY column has NaN values - with the following code:
df = df.dropna(subset=["SPY"])Documentation
How to Plot on "Equal Footing" Quiz
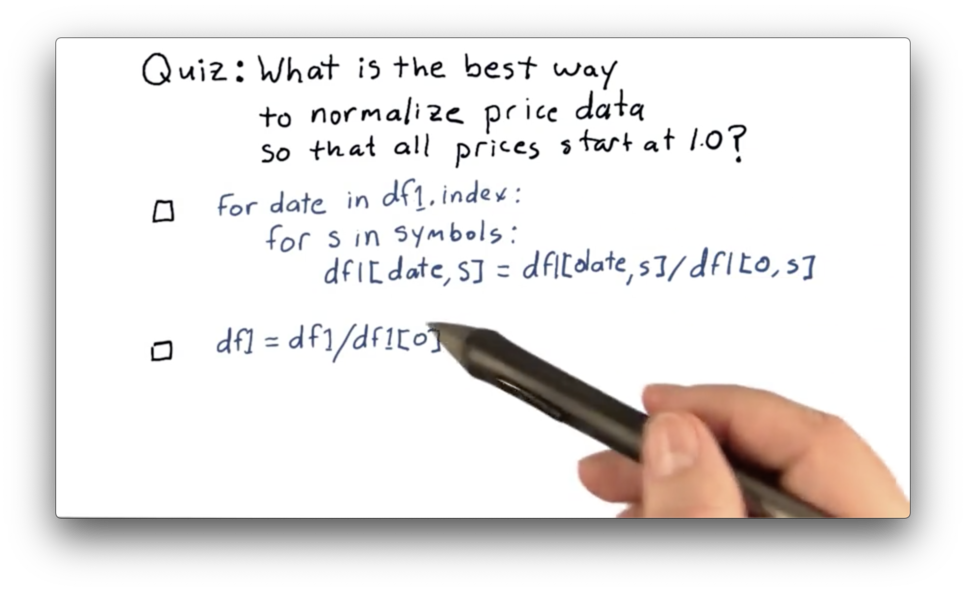
How to Plot on "Equal Footing" Quiz Solution
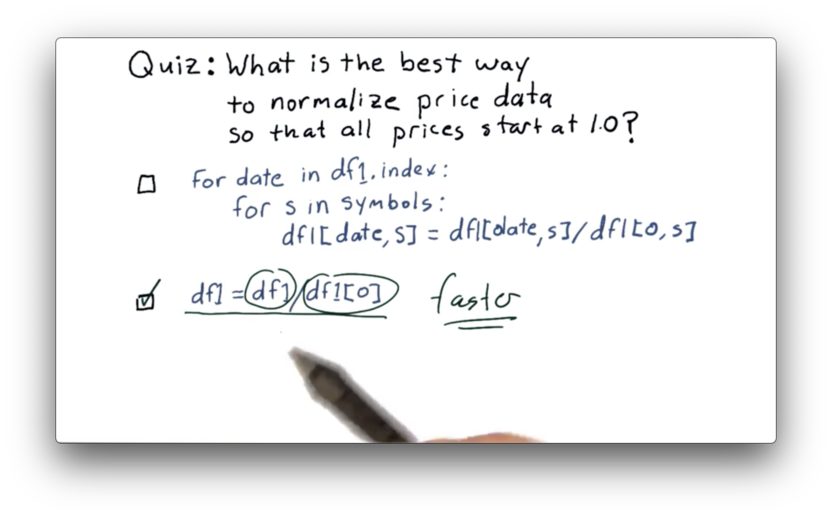
While both of these are technically correct, the second approach leverages vectorization which is must faster than the iterative approach. Read more about vectorization here.
Slice and Plot Two Stocks Quiz
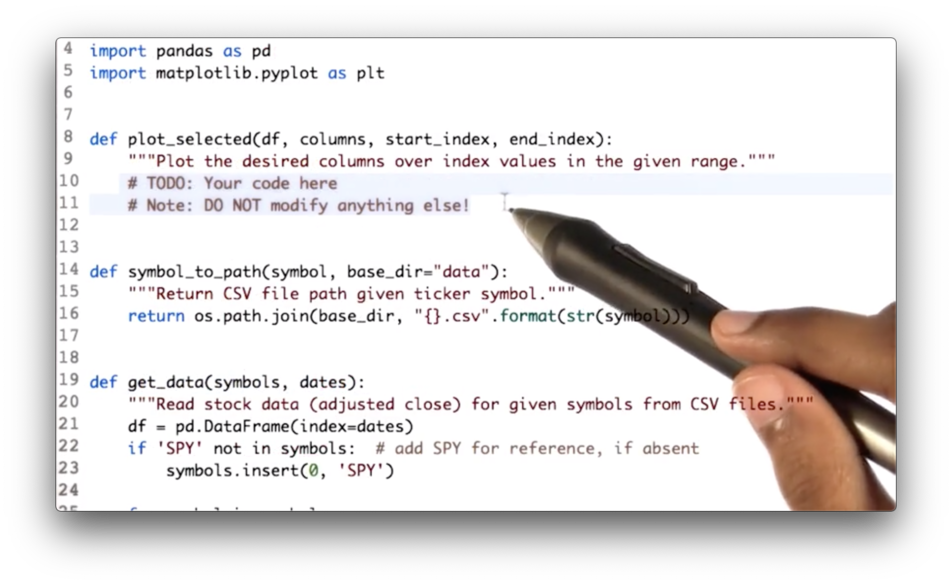
Your task is to write code that first slices df along the rows bounded by start_index and end_index and across columns, and then passes the slice to the plot_selected method.
Slice and Plot Two Stocks Quiz Solution
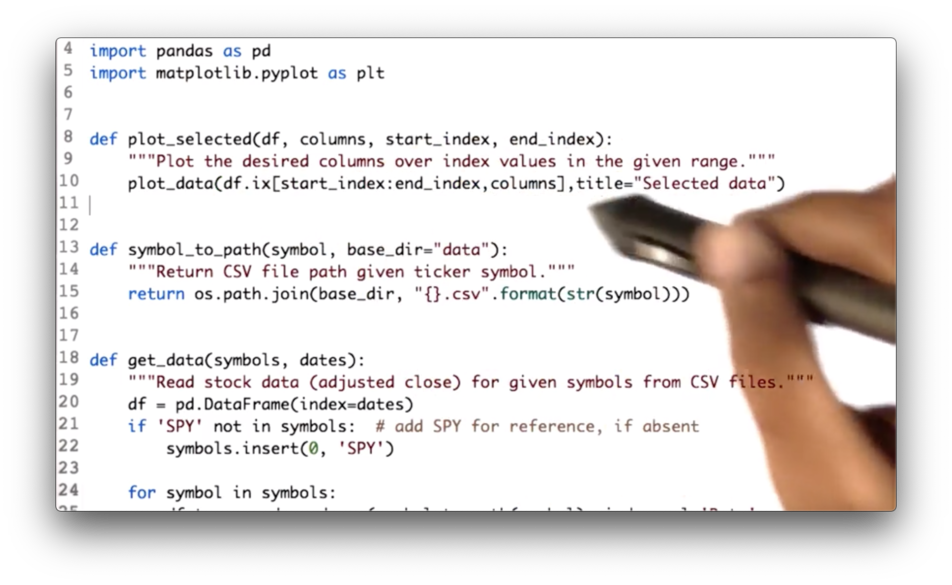
We can create our slice using the following code, which we then pass to the plot_data method:
df.ix[start_index:end_index, columns]Documentation
The Power of NumPy
Replace a Slice Quiz
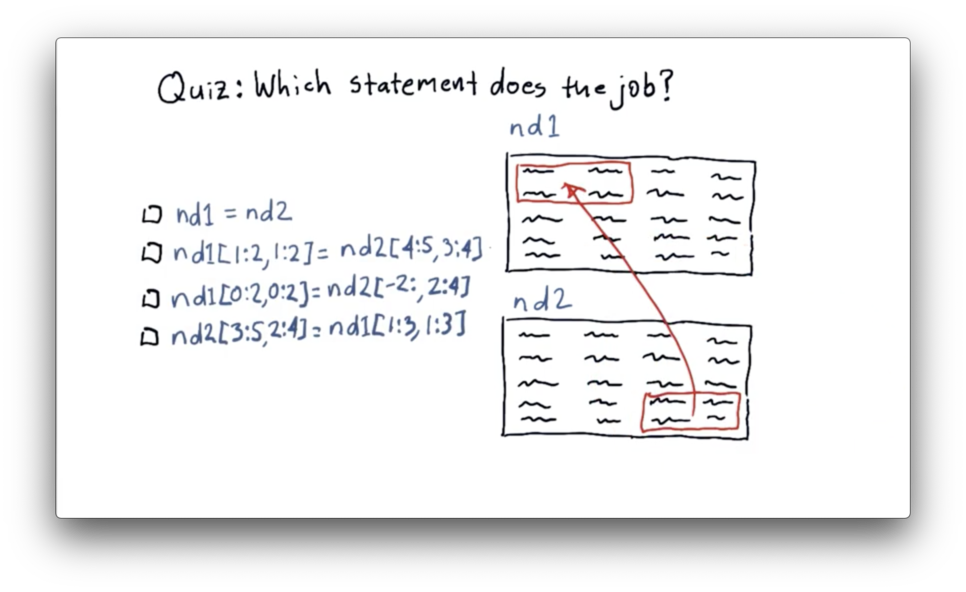
We need to move data from the last two rows and the last two columns of nd2 to the first two rows and the first two columns of nd1.
Replace a Slice Quiz Solution
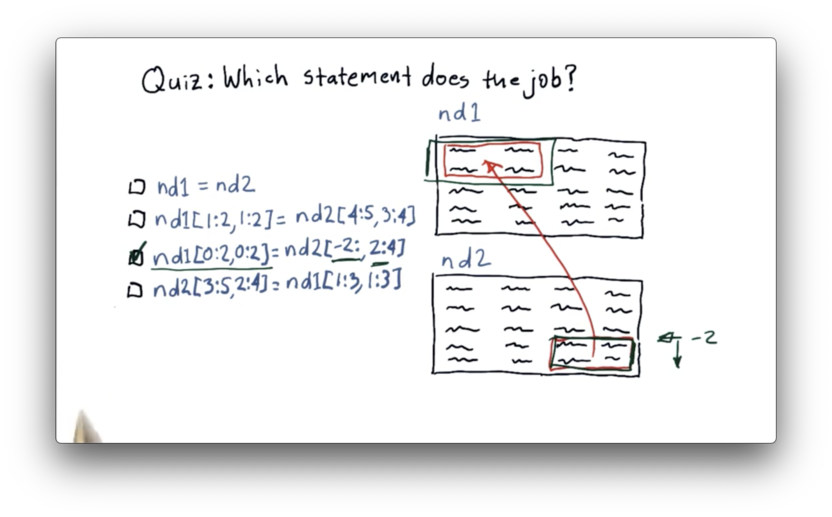
Let's first look at how we can slice nd2 to extract the data we want. We can slice the last two rows using negative indexing: -2:. We can slice the last two columns as 2:4. Remember that NumPy indexing is upper-bound exclusive.
Now let's see how we can transplant that data into nd1. We can select the first two rows of nd1 as 0:2, and we can select the first two columns as 0:2.
The complete data transfer can be accomplished with the following code:
nd1[0:2, 0:2] = nd2[-2:, 2:4]Documentation
Specify the Data Type Quiz
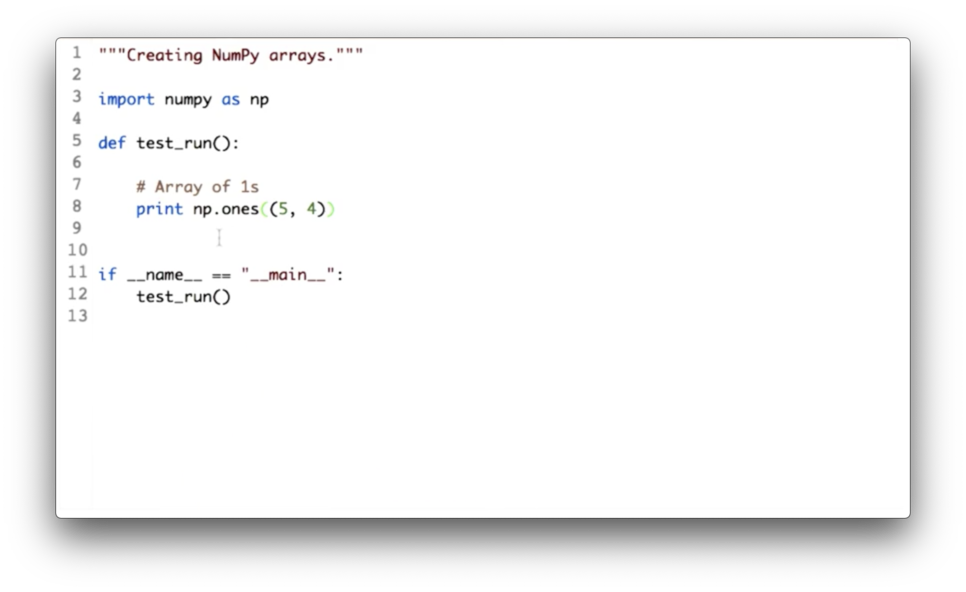
We saw that the elements in an array created by np.ones are floats by default. Our task here is to update the call to np.ones and pass in a parameter that tells NumPy to give us integers instead of floats.
Specify the Data Type Quiz Solution
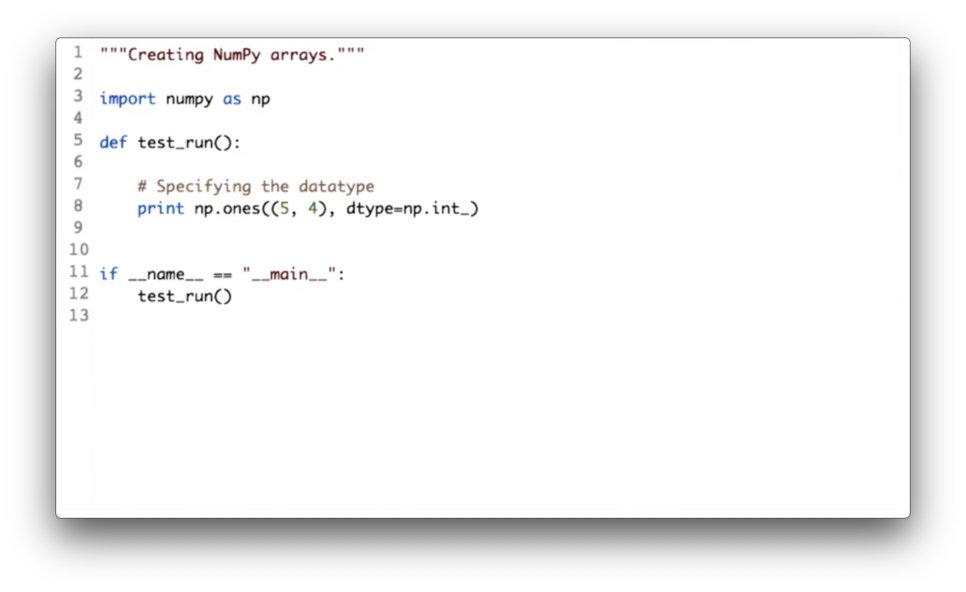
We can accomplish this change with the following code:
np.ones((5, 4), dtype=np.int_)Documentation
Locate Maximum Value Quiz
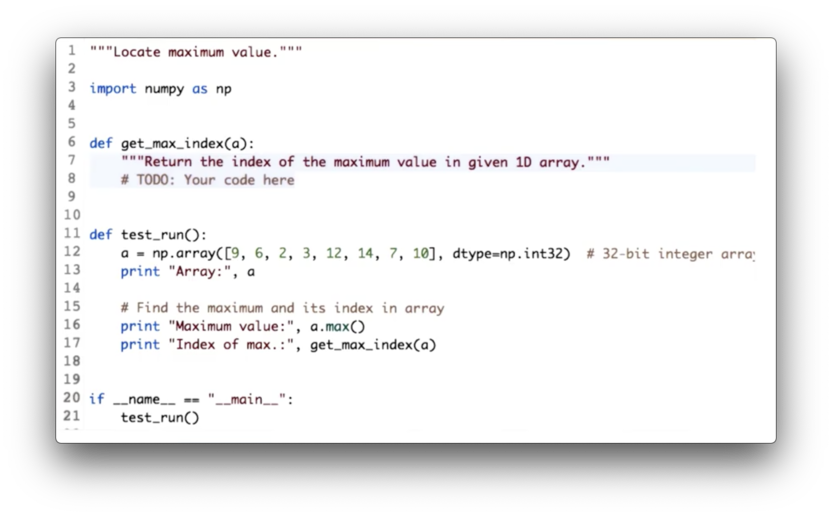
Our task is to implement the function get_max_index, which takes a one-dimensional ndarray a and returns the index of the maximum value.
Locate Maximum Value Quiz Solution
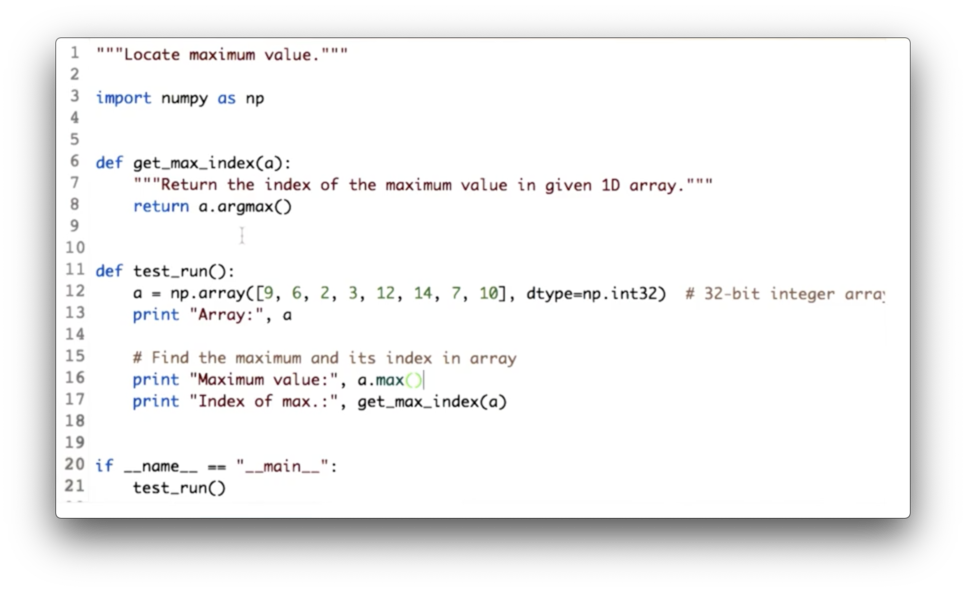
We can retrieve the index of the maximum value in a with the argmax method:
def get_max_index(a):
	return a.argmax()
Documentation
Statistical Analysis of Time Series
Which Statistic to Use Quiz
Assume we are using a rolling mean to track the movement of a stock. We are looking for an opportunity to find when the price has diverged significantly far from the rolling mean, as we can use this divergence to signal a buy or a sell.
Which statistic might we use to discover if the price has diverged significantly enough?
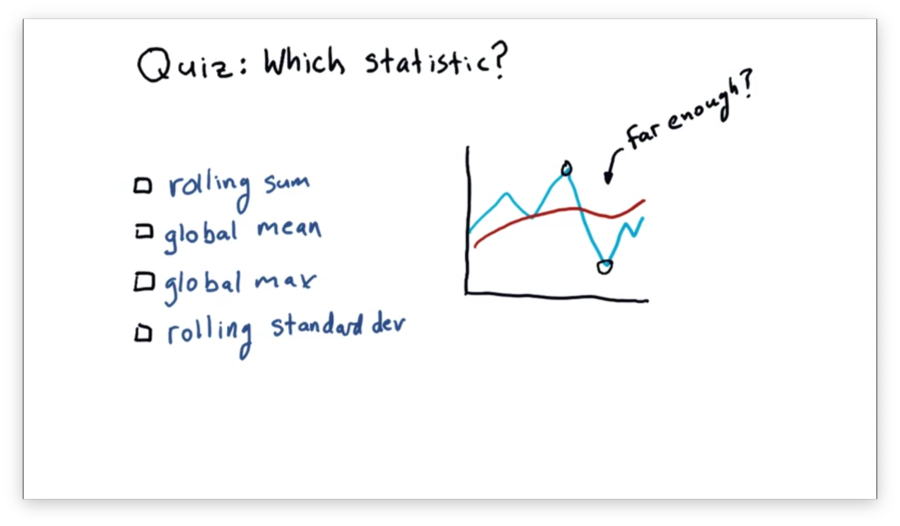
Which Statistic to Use Quiz Solution
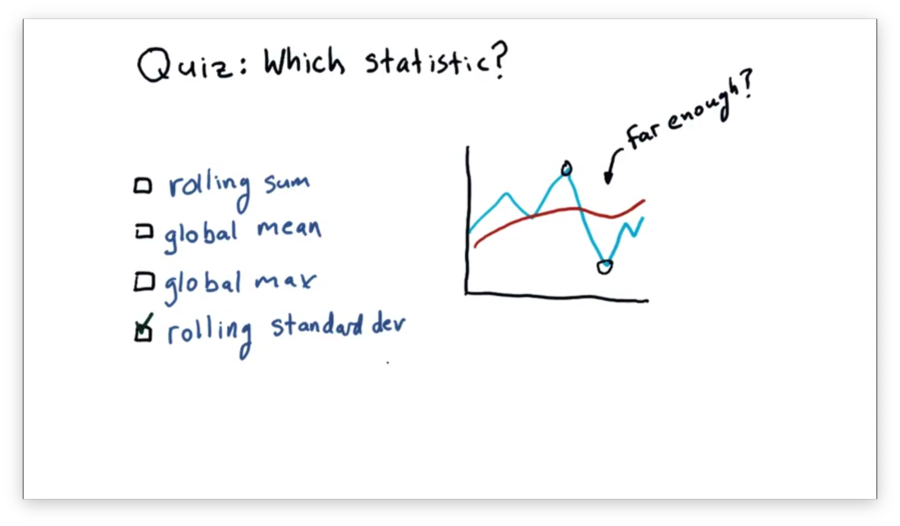
Standard deviation gives us a measure of divergence from the mean. Therefore, if the price breaches the standard deviation, we may conclude that the price has moved significantly enough for us to consider buying or selling the stock.
Calculate Bollinger Bands Quiz
Computing Bollinger bands consists of three main steps: first, computing the rolling mean; second, computing the rolling standard deviation and; third, computing the upper and lower bands.
Our goal is to implement the three functions below to accomplish these tasks.
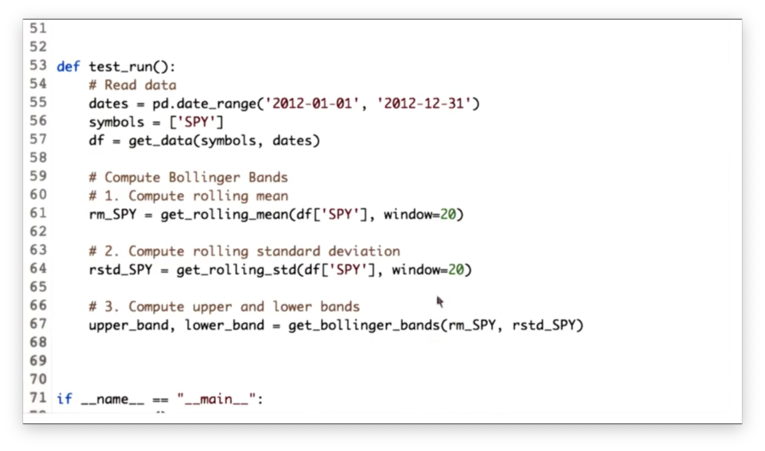
Calculate Bollinger Bands Quiz Solution
Given an ndarray values and a window window, we can calculate the rolling standard deviation as follows:
# OLD
pd.rolling_std(values, window=window)

# NEW
values.rolling(window).std()
Given a rolling mean rm and a rolling standard deviation rstd, we can calculate the Bollinger bands as follows:
rm + (2 * rstd), rm - (2 * rstd)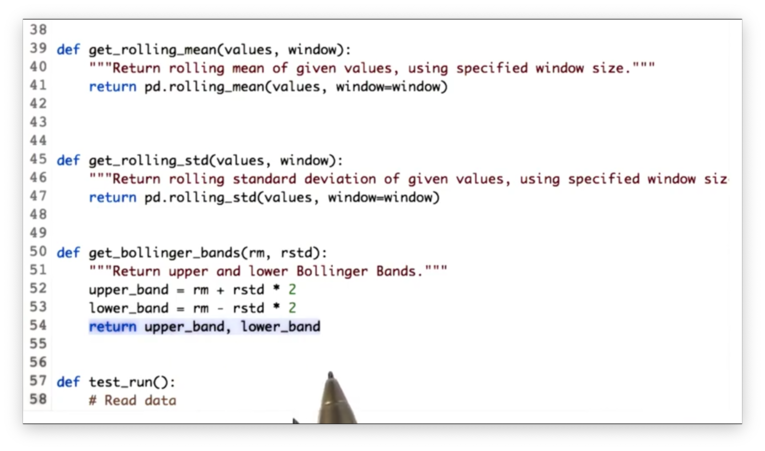
Documentation
Compute Daily Returns Quiz
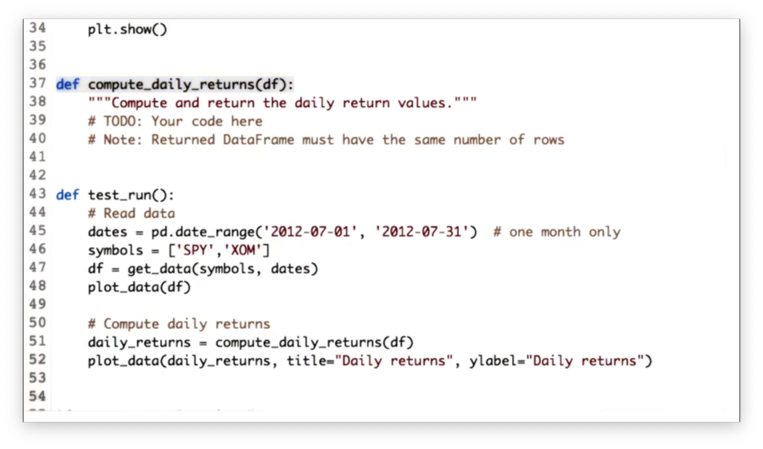
Our task is to implement a function compute_daily_returns that receives a DataFrame df and returns a DataFrame consisting of the daily return values. The returned DataFrame must have the same number of rows as df, and any rows with missing data must be filled with zeroes.
Compute Daily Returns Solution
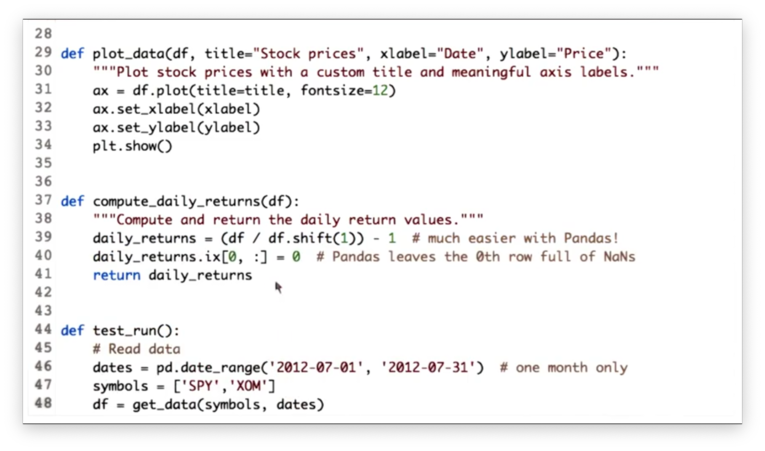
Given a DataFrame df with n rows, we can create a new DataFrame with n + m rows where each row is shifted down m rows with the following code:
df.shift(m)Note that the newly created m rows at the top of the DataFrame will be filled with NaN values.
Therefore, we can divide every price in our DataFrame df by the price on the previous day like this:
df / df.shift(1)We can complete the daily return calculation, and generate a DataFrame daily_returns like so:
df / df.shift(1) - 1The only thing we have to consider now is the first row in daily_returns. Since the first row in the shifted DataFrame is filled with NaN values, any subsequent mathematical operations on those values yield NaN.
However, our task was to fill any rows with missing data with zeroes. We can fix daily_returns like this:
# Deprecated
daily_returns.ix[0, :] = 0

# Use this
daily_returns.iloc[0] = 0
Documentation
Incomplete Data
Pandas fillna() Quiz
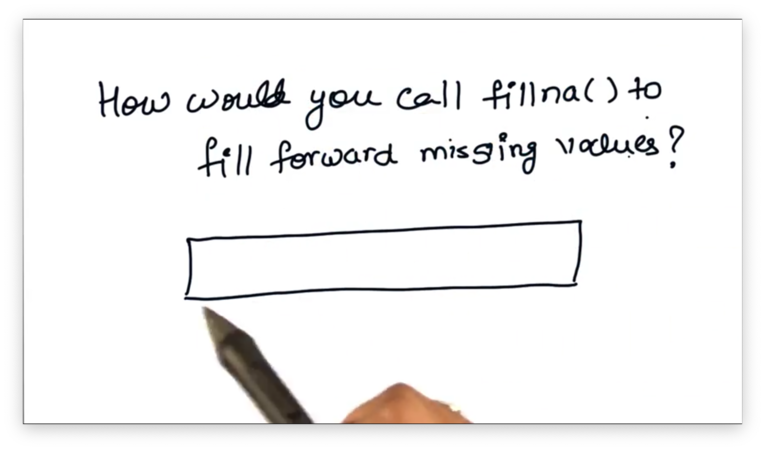
Our task is to find the parameter that we need to pass to fillna to fill forward missing values.
Pandas fillna() Quiz Solution
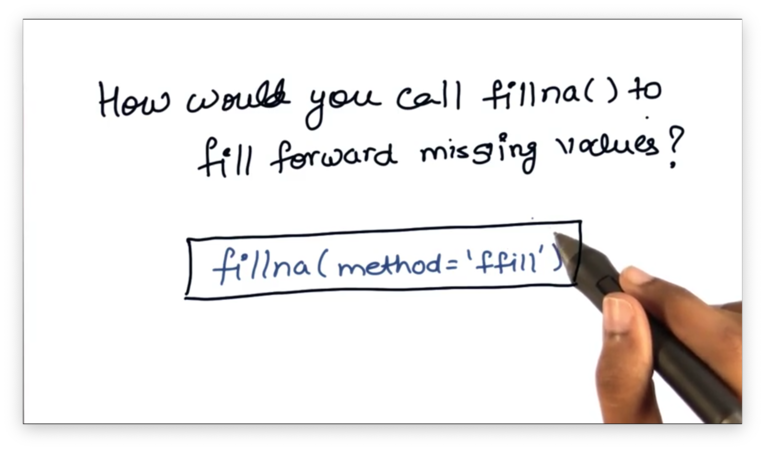
Documentation
Fill Missing Values Quiz
If we look at the following plot of stock price data, we can see several gaps.
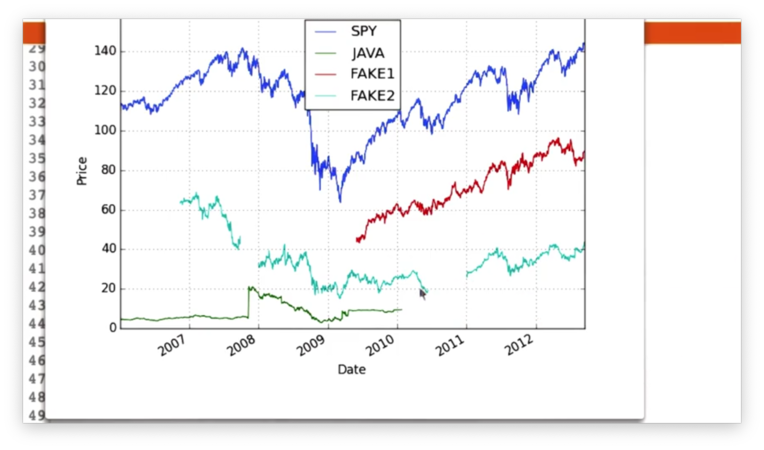
Our task is to use the fillna method to fill these gaps.
Fill Missing Values Solution
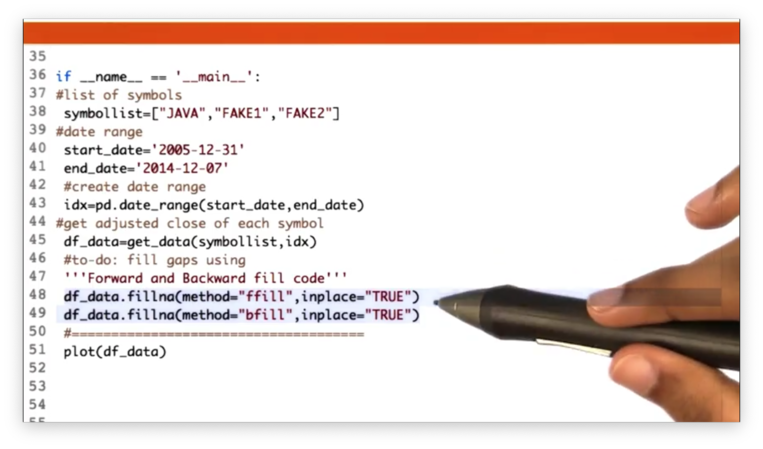
We can use forward filling for gaps that have a definitive start date, and backward filling for gaps that have no beginning or begin before our date range.
Documentation
Histograms and Scatter Plots
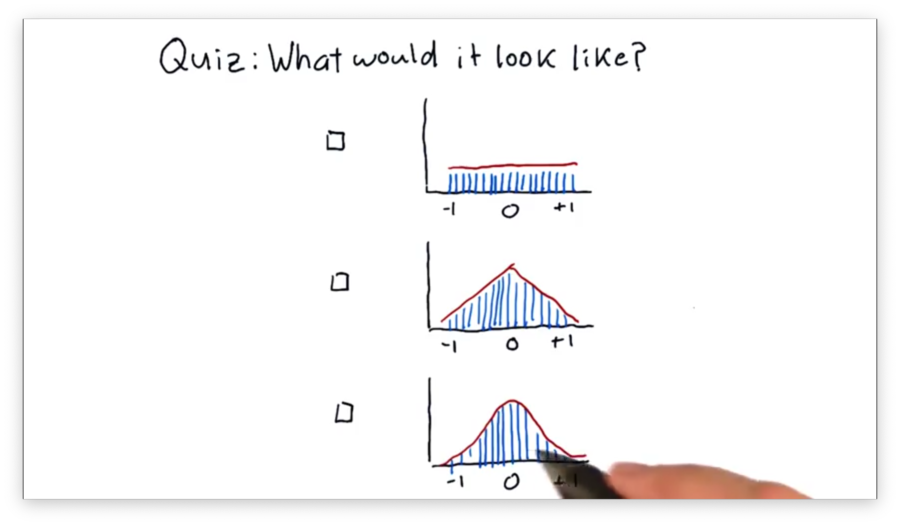
What Would it Look Like Quiz
Suppose that we've taken all of the SPY pricing data from over the years, generated an array of daily returns, and created a histogram from those returns.
Which of the following shapes would the histogram most likely have?
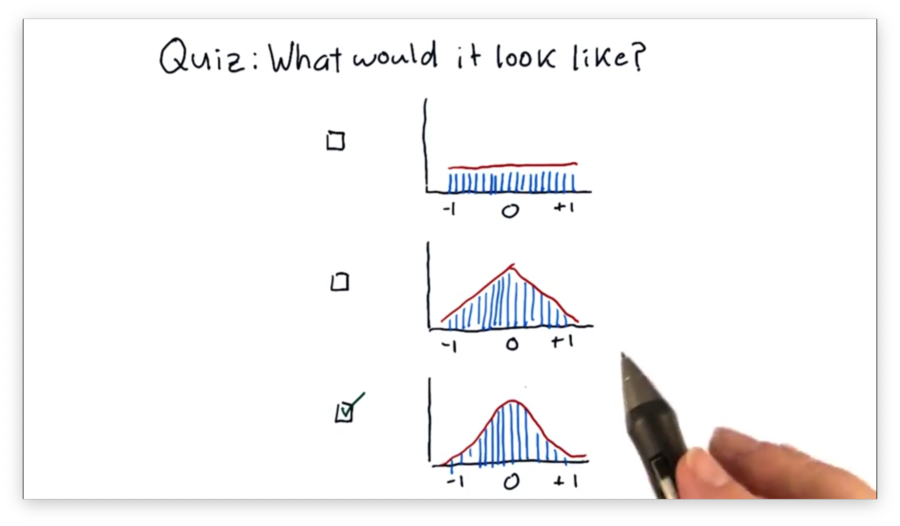
What Would it Look Like Quiz Solution
Compare Two Histograms Quiz
A common practice in finance is to plot histograms of the daily returns of different stocks together to assess how the stocks relate to each other.
Below are the daily returns histograms for SPY and XYZ, as well as three statements describing the relationship between the two.
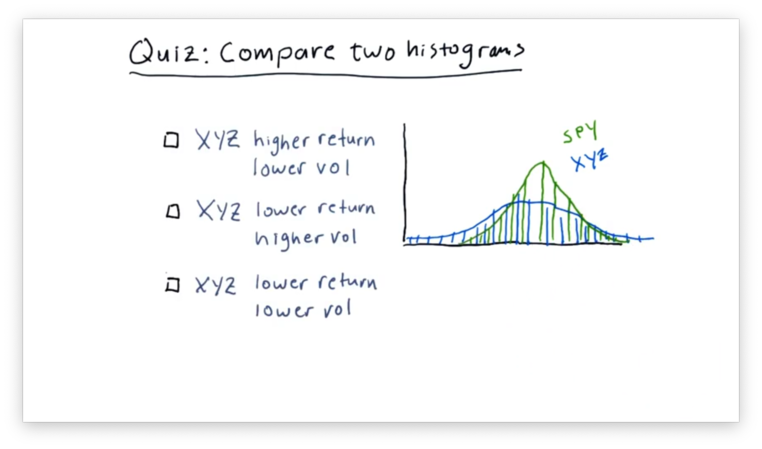
Which statement do you think is correct?
Note that "vol" refers to volatility and not volume.
Compare Two Histograms Quiz Solution
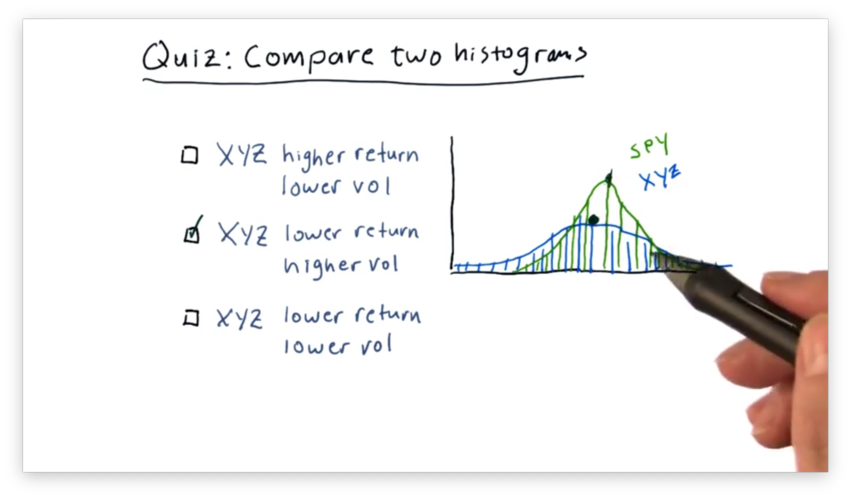
We can see that the mean of SPY is slightly higher than the mean of XYZ, indicating that SPY outperforms XYZ.
Additionally, we can see that the XYZ curve is "flatter" than the SPY curve. This feature indicates that the daily returns of XYZ are more spread out than those of SPY, which are more centralized.
In summary, XYZ has both lower returns and higher volatility than SPY.
Correlation vs. Slope Quiz
Given what we just learned about correlation and slope (beta), let's look at two scatterplots with their best-fit lines, and choose the most accurate statement.
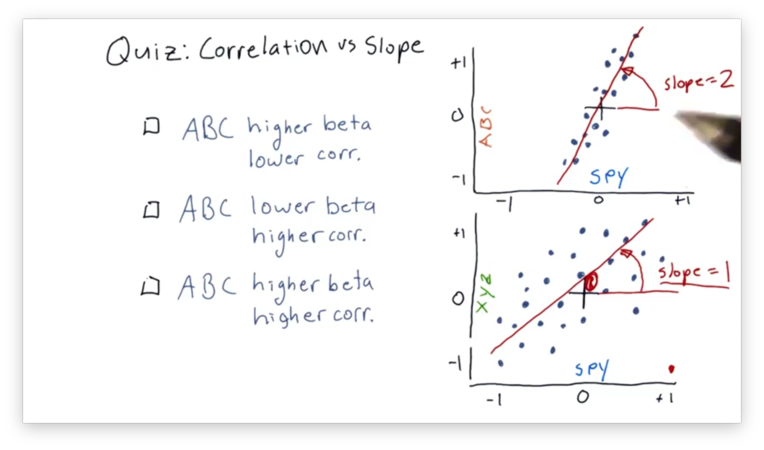
Correlation vs. Slope Quiz Solution
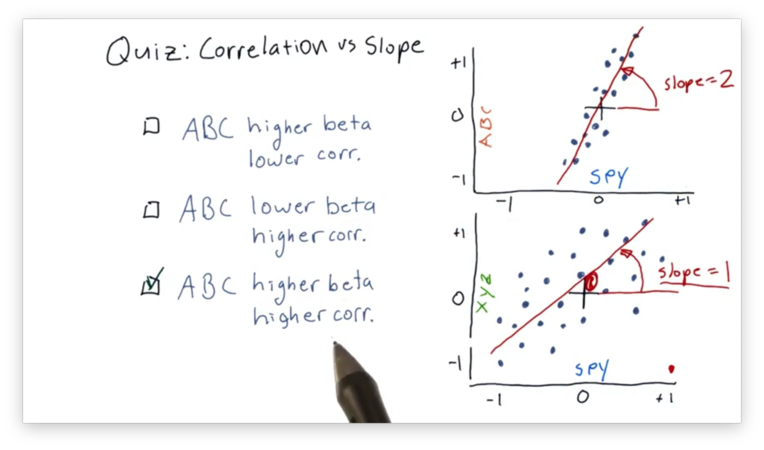
The best-fit line in the SPY vs. ABC scatterplot has a higher beta because that line has a larger slope than the corresponding line in the SPY vs. XYZ plot.
Additionally, the SPY and ABC daily returns are more highly correlated, which can be determined visually from examining how "tightly" they hug the best-fit line in the SPY vs. ABC plot.
Sharpe Ratio and Other Portfolio Statistics
Which Portfolio is Better Quiz
The Sharpe ratio allows us to consider our returns in the context of risk: the standard deviation, or volatility, of the returns. When we look at portfolio performance, we don't typically look at raw returns; instead, we adjust the returns received for the risk borne.
With this in mind, let's look at three comparisons of two stocks, ABC and XYZ, and decide which is better.
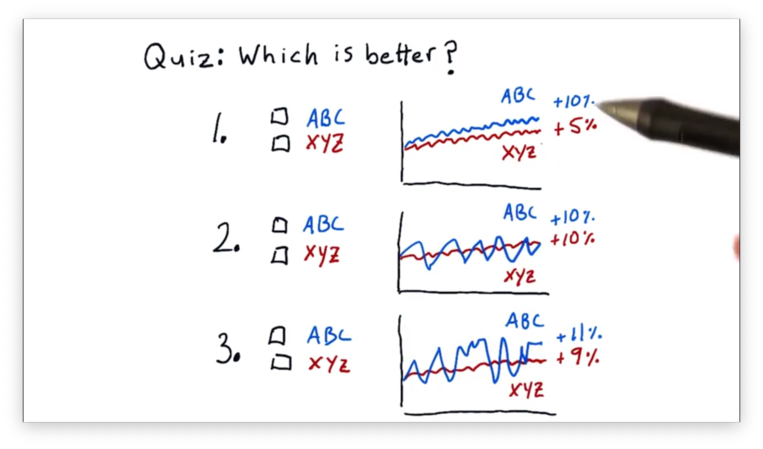
Which Portfolio is Better Quiz Solution
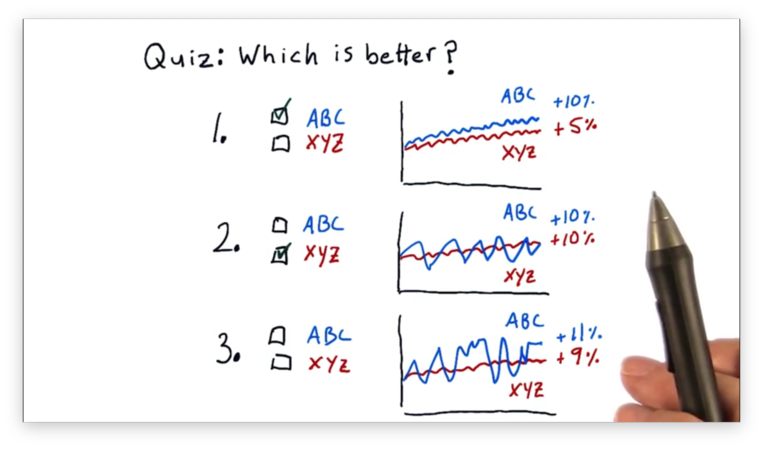
For the first comparison, ABC is better. ABC and XYZ have similar amounts of volatility, but ABC has double the return of XYZ.
For the second comparison, XYZ is better. Both ABC and XYZ have the same return, but ABC is much more volatile than XYZ.
For the third comparison, we can't tell which is better, given the information provided. ABC has a higher return than XYZ, but that return is offset by higher volatility.
We need a qualitative measure to compare ABC and XYZ in this third example, and the Sharpe ratio is that measure.
Form of the Sharpe Ratio Quiz
Consider the following three factors.
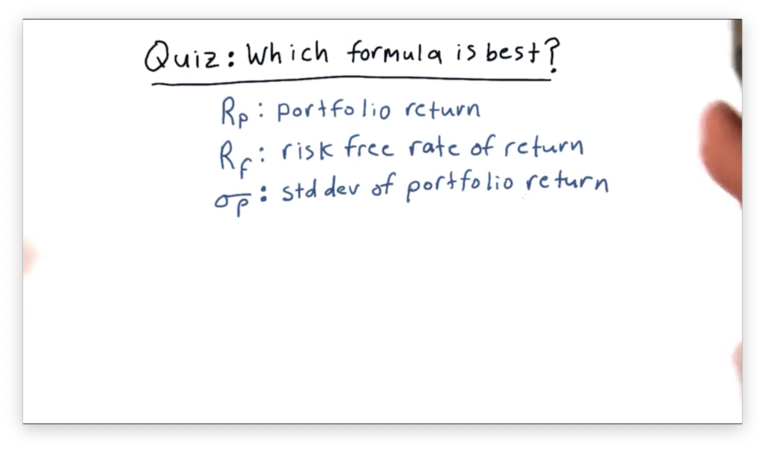
How would you combine these three factors into a simple equation to create a metric that provides a measure of risk-adjusted return?
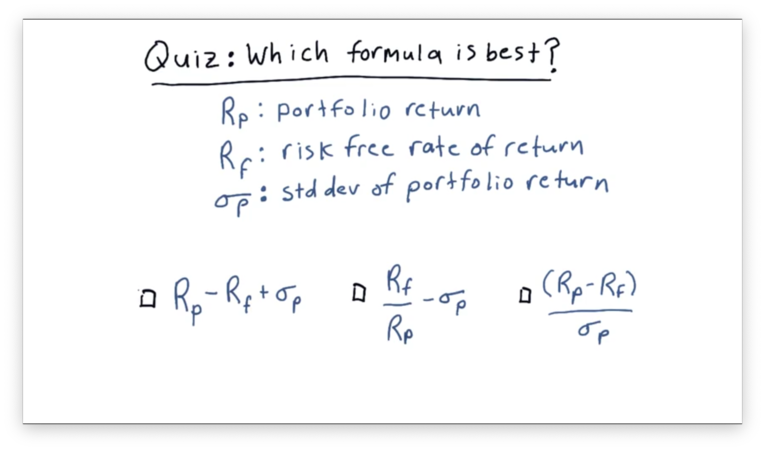
Form of the Sharpe Ratio Quiz Solution
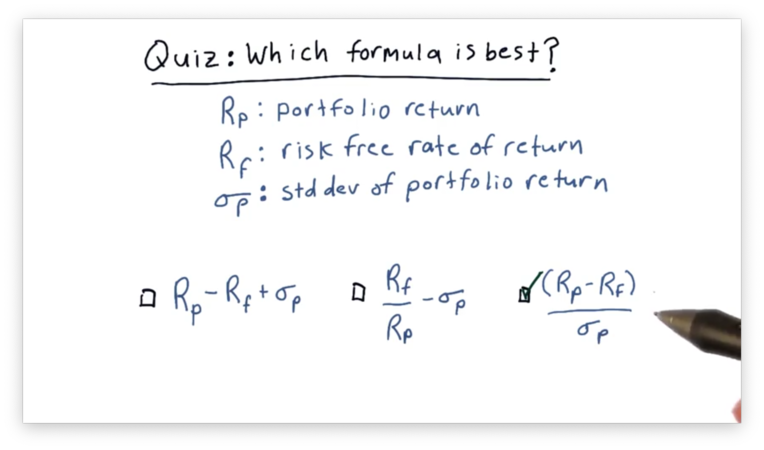
Only the third choice meets the two criteria we described earlier; all else being equal, higher returns increase our metric, and lower risk increases our metric. Additionally, a higher rate of risk-free return decreases our metric.
What is the Sharpe Ratio Quiz
Assume we have been trading a strategy for 60 days now. On average, our strategy returns one-tenth of one percent per day. Our daily risk-free rate is two one-hundredths of a percent. The standard deviation of our daily return is one-tenth of one percent.
What is the Sharpe ratio of this strategy?
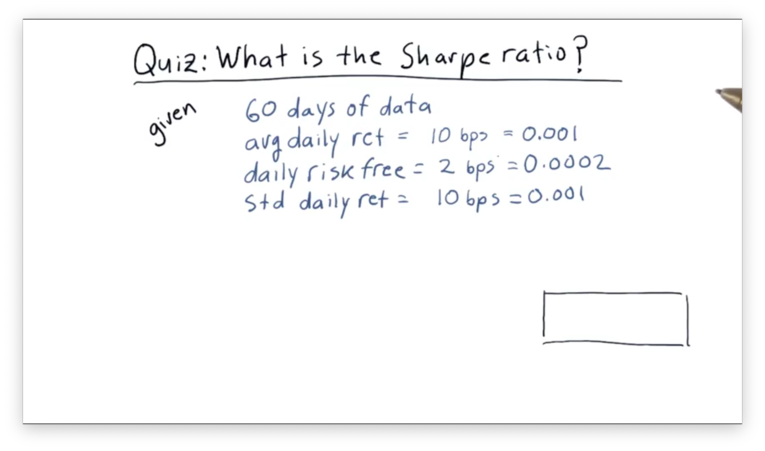
In financial terminology, one one-hundredth of one percent is known as a basis point, or "bip". Instead of saying, for example, that our strategy returns one-tenth of one percent per day, we could say it returns 10 bps per day.
What is the Sharpe Ratio Quiz Solution
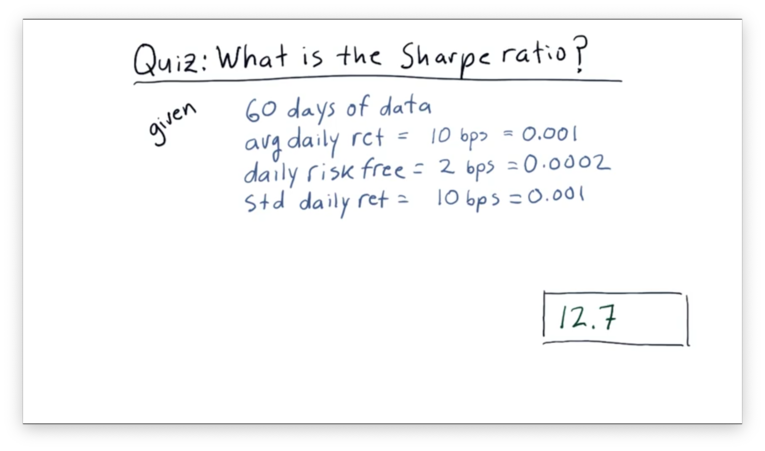
Let's recall our formula for the Sharpe ratio:
Given that on average, on average, and , with a daily sample rate:
Optimizers: Building a Parameterized Model
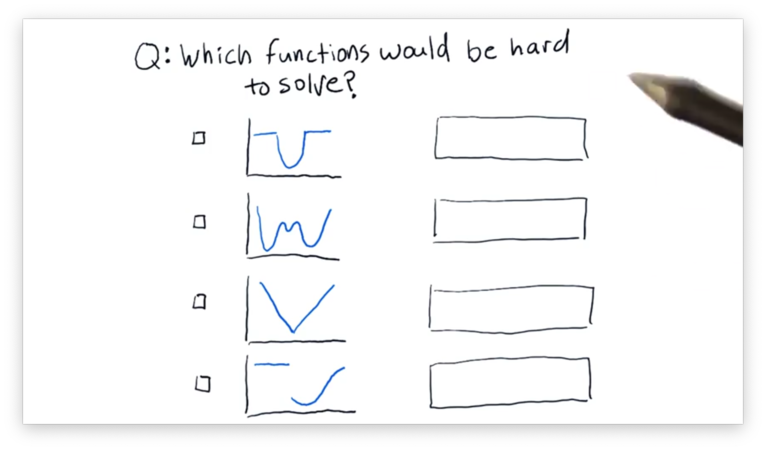
How to Defeat a Minimizer Quiz
Which of the following functions would be hard for the minimizer to solve?
How to Defeat a Minimizer Quiz Solution
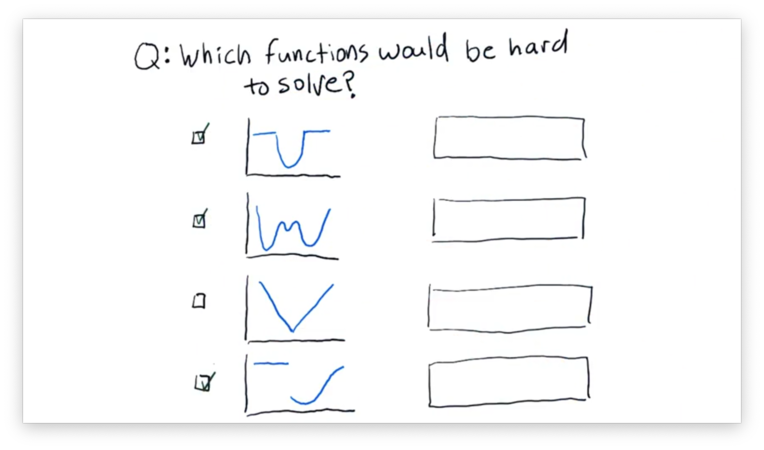
The first graph is hard because of the "flat" areas on either side of the parabola. A minimizer testing a point in the middle of this area wouldn't be able to find any gradient to follow, so it wouldn't know how to adjust the value it was currently testing.
The second graph is hard because it has several local minima that aren't necessarily the global minimum. A minimizer might "get stuck" in a local minimum, even though a more significant, global minimum exists.
The fourth graph is challenging both because of the "flat" area and the discontinuity between the two halves.
What is a Good Error Metric Quiz
Let's assume that a point has an error , which is the vertical distance between and the best-fit line currently under consideration. Given a number of such errors , which of the following expressions describes the metric we want to minimize?
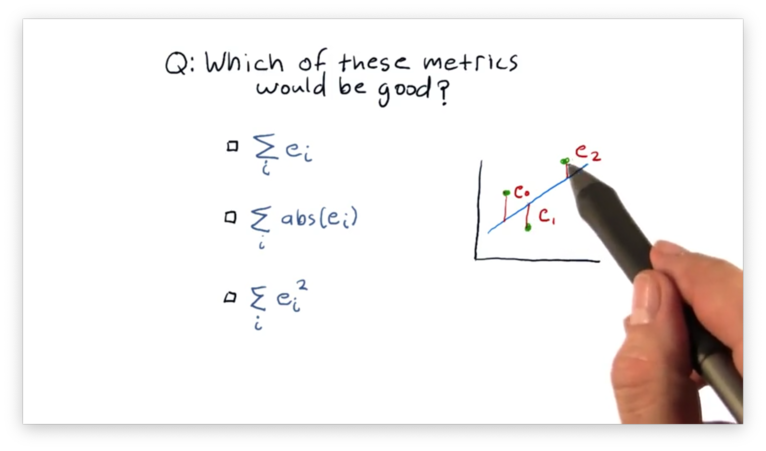
What is a Good Error Metric Quiz Solution
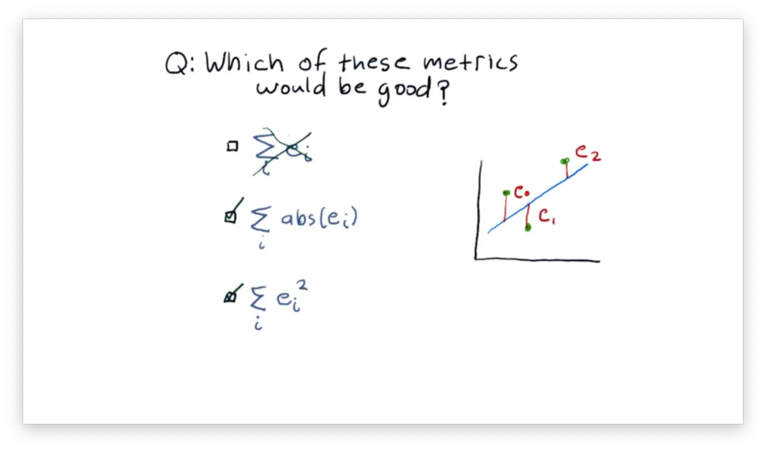
We want to minimize the sum of the errors, but we want to ensure that errors above and below the line do not cancel out. To accomplish this, we need to make each error positive by either squaring it or taking its absolute value.
Optimizers: How to Optimize a Portfolio
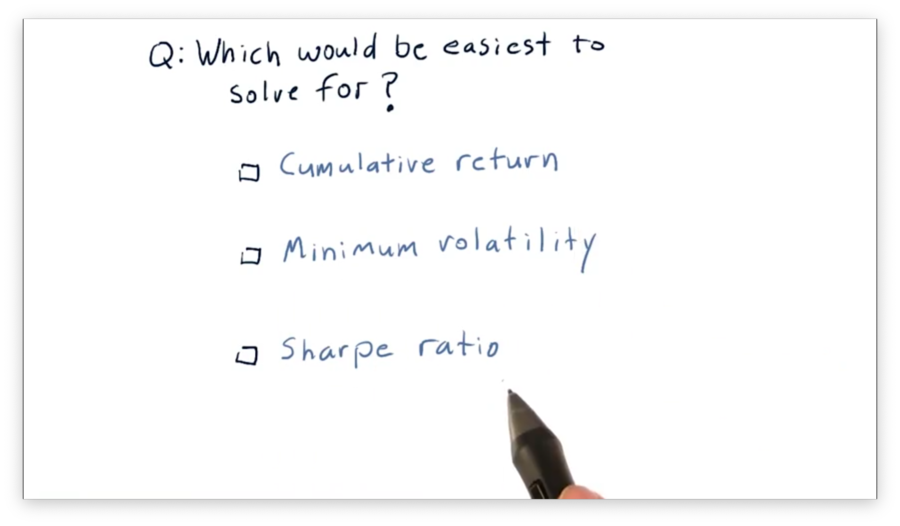
Which Criteria is Easiest to Solve For Quiz
Let's assume we have a portfolio of four stocks, and we want to find the optimal allocations that maximize some performance metric. Which of the following metrics would be easiest to optimize for?
Which Criteria is Easiest to Solve For Quiz Solution
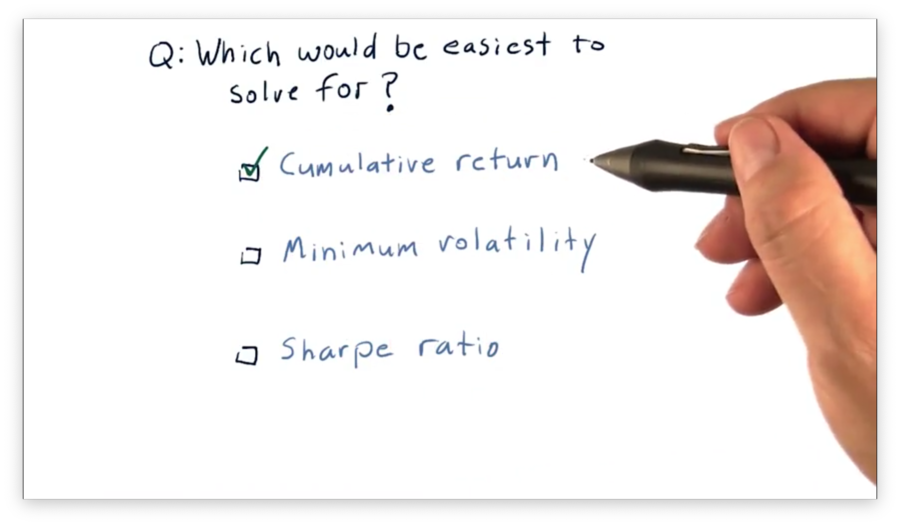
It would be easiest to write an optimizer for cumulative return. To do so, all we need to do is allocate 100% of our portfolio into whichever stock had the highest cumulative return.
Optimizing for minimum volatility or Sharpe ratio involves evaluating various combinations of stocks, which is more complicated than simply putting all our eggs in one basket.
How Machine Learning is Used at a Hedge Fund
What's X and Y Quiz
Let's think about building a model to use in trading. Which of the following factors might be input values () to the model, and which might be output values ()?
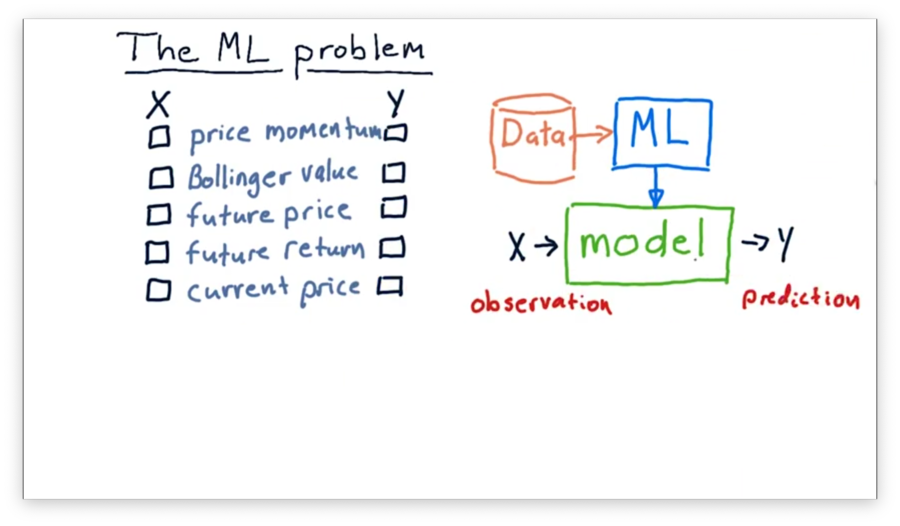
What's X and Y Quiz Solution
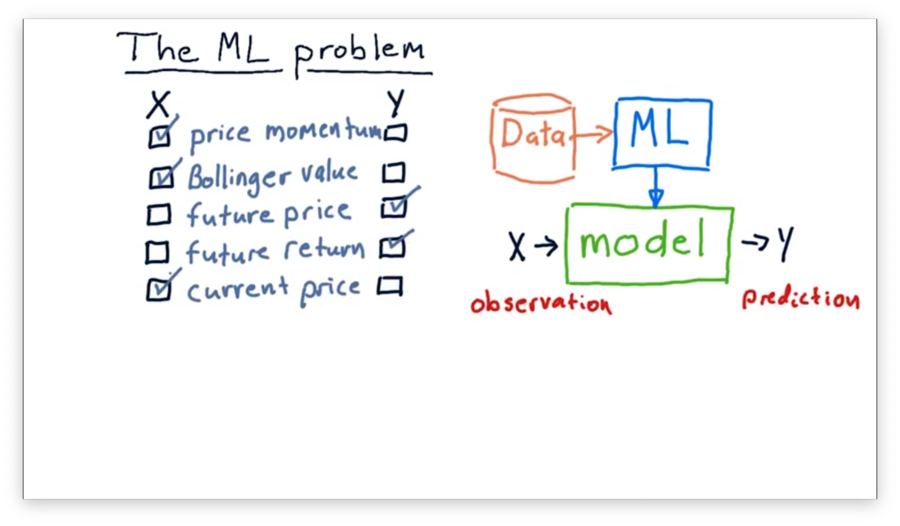
Since we often use models to predict values in the future, both future price and future return make sense as output values. Our model might make these predictions by considering price momentum, current price, and Bollinger values as input.
Regression
How to Predict Quiz
We've identified that, in KNN, for a particular query , we want to utilize the nearest data points to to come up with a prediction. What should we do with those neighboring data points to find that prediction?
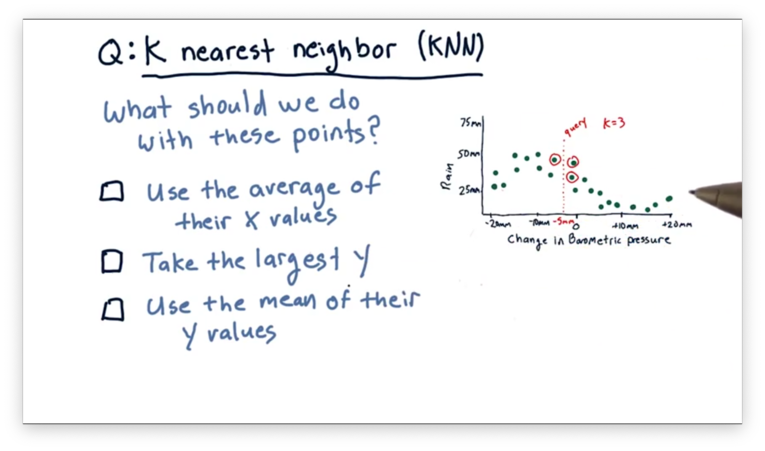
How to Predict Quiz Solution
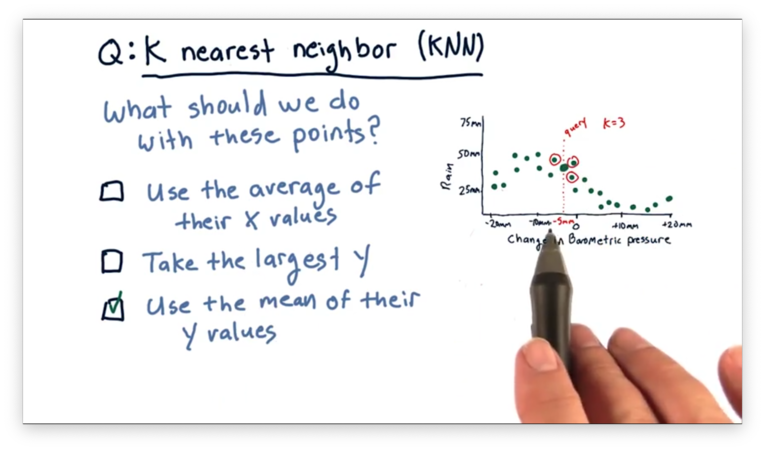
Remember that we want to predict a -value for the queried -value. As a result, it doesn't make sense to take the average of the -values of the nearest neighbors. Additionally, we don't want to take the largest -value; otherwise, the other neighbors have no influence on the prediction. The correct approach here is to take the mean of their -values.
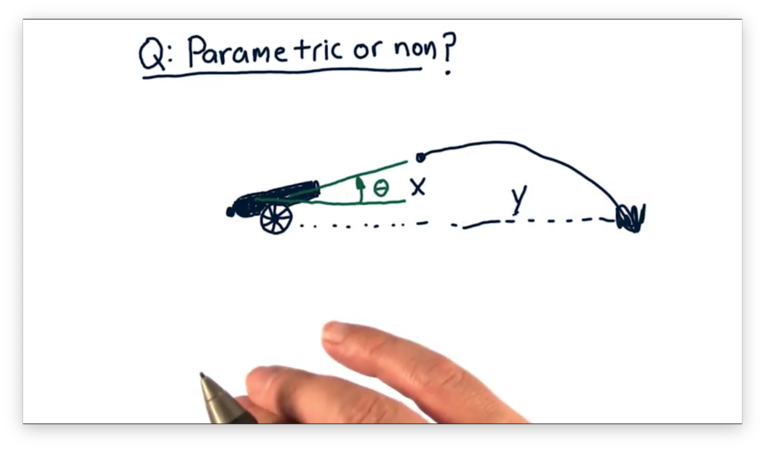
Parametric vs Non-Parametric Quiz
Let's consider the relationship between variables in two different scenarios.
The first scenario involves firing a cannon. The independent variable is the value of the angle that the cannon makes with the ground, and the dependent variable is the horizontal distance the cannonball travels.
The second scenario involves attracting bees to a food source. The independent variable is the richness of the food source, and the dependent variable is the number of bees attracted to that source.
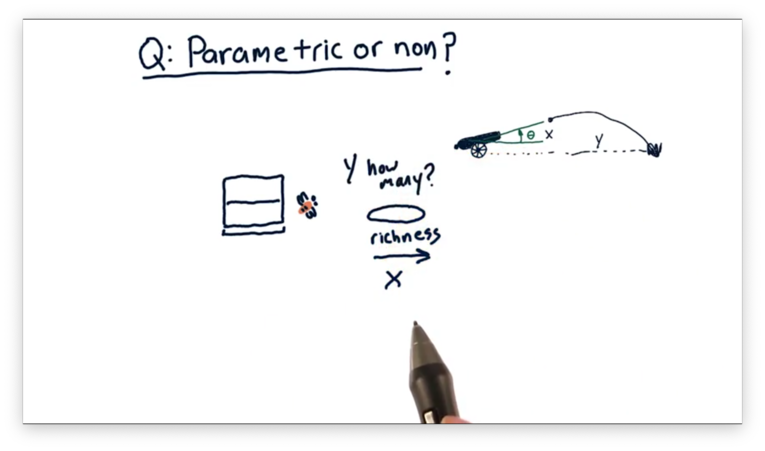
Note that this scenario is slightly different than the first because it's not clear that the number of bees always increases as richness increases.
Given these two scenarios, which, if any, is better modeled using a parametric model, and which, if any, is better modeled using a non-parametric model?
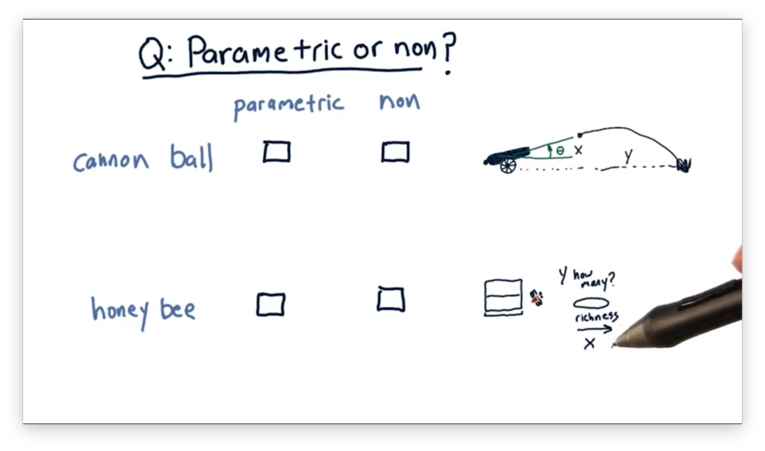
Parametric vs Non-Parametric Quiz Solution
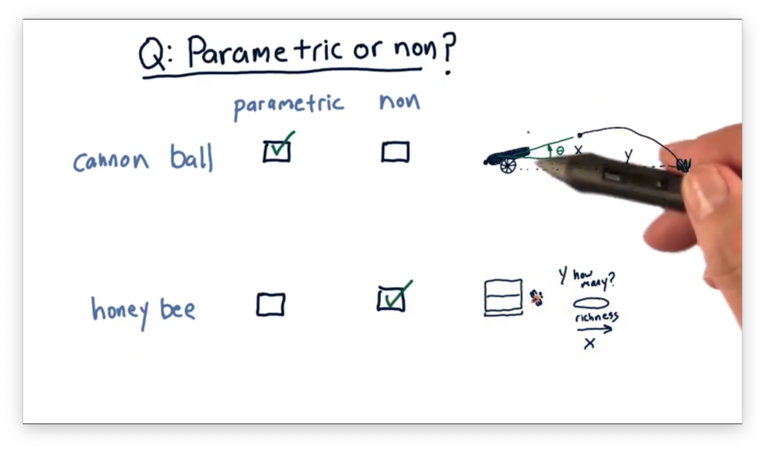
In the first scenario, we can start with an estimate of the underlying behavior of the system in terms of a mathematical equation that expresses how it behaves. This equation is just the equation of trajectory, which we can find online. We can then learn the parameters of this equation such that it describes the relationship between our variables.
In the second scenario, we have no initial estimate for the underlying mathematical equation, so it's better to use a non-parametric model, which can model any "shape" of relationship.
Assessing a Learning Algorithm
What Happens as K Varies Quiz
Consider the following three models, each generated using a different value for .
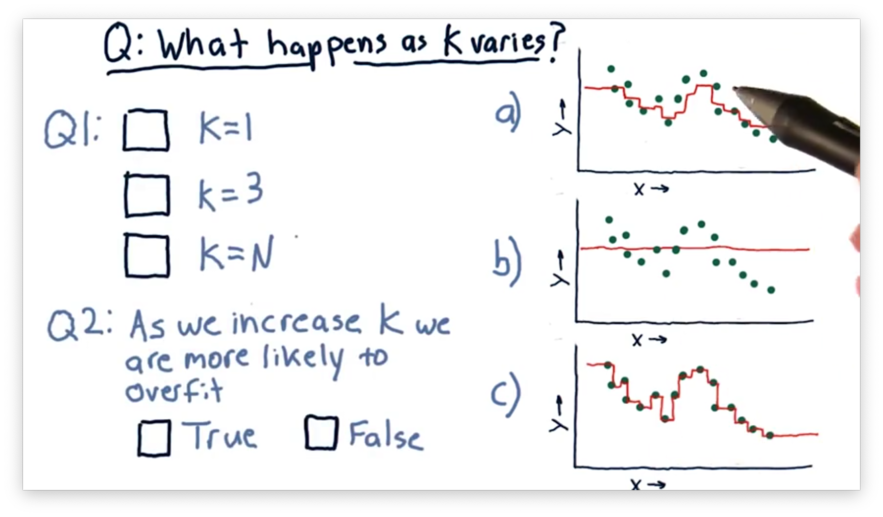
Our first task is to match the value of with the corresponding plot. Our second task is to decide whether we increase the chances of overfitting as we increase . An overfit model matches the training set very well but fails to generalize to new examples.
What Happens as K Varies Quiz Solution
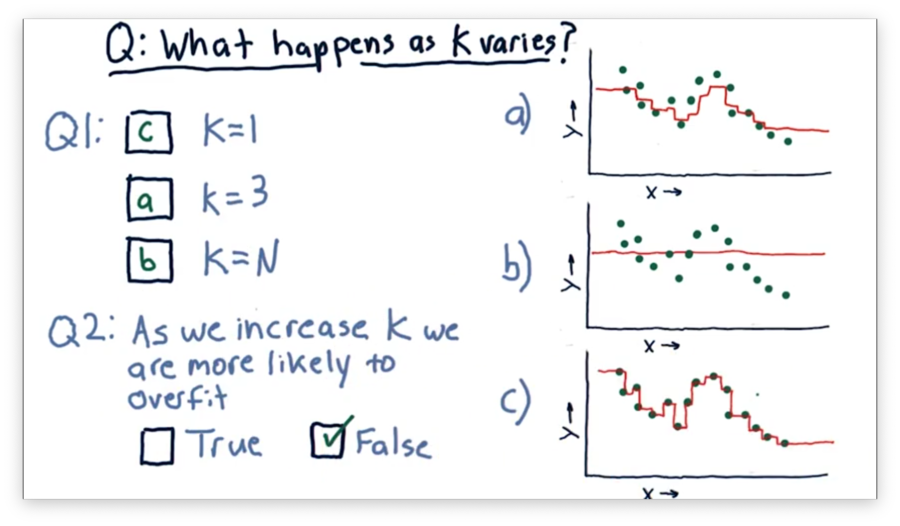
Let's consider the case where . In this case, the model passes through every point directly, since near , the only point that has any influence is .
Now consider the case where . In this case, every point considers all of the neighbors. Thus, the generated model is a straight line passing through the mean of the values of all the points.
Of course, when , the graph lies between these two extremes. For , the graph roughly follows the points without passing through them directly.
As a result, we see that increases in decrease the probability of overfitting.
What Happens as D Varies Quiz
Consider the following three polynomial models. The difference between each model is the degree of the polynomial .
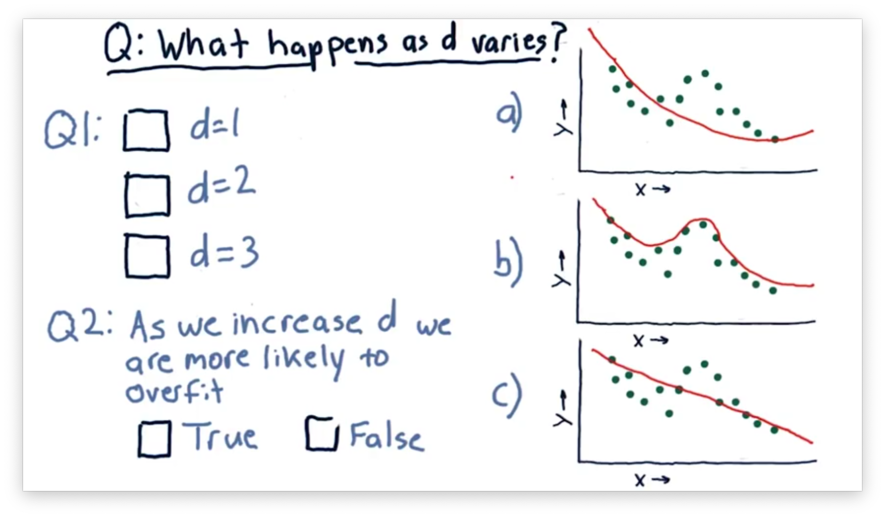
Our first task is to match the value of with the corresponding plot. Our second task is to decide whether we increase the chances of overfitting as we increase .
What Happens as D Varies Quiz Solution
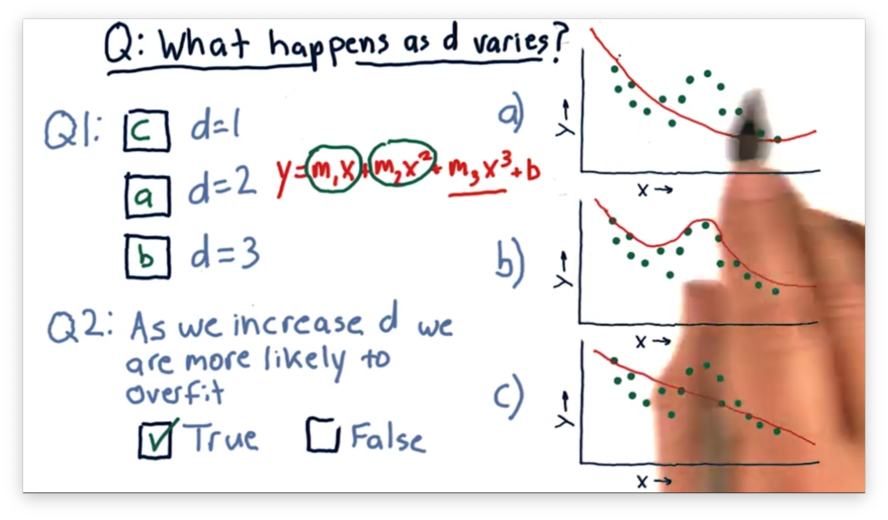
A polynomial of degree one matches the equation , which is the equation of a line and corresponds to the third plot.
A polynomial of degree two matches the equation , which is the equation of a parabola and corresponds to the first plot.
A third-order polynomial matches the equation , which corresponds to the second plot.
We see that as we increase , our model begins to follow the points more closely. Indeed, it can be shown that for points, a parabola of degree exists that passes through each point.
Notice that for each of these models, we can extrapolate beyond the data given. This ability to extrapolate is a property of parametric models that instance-based models lack.
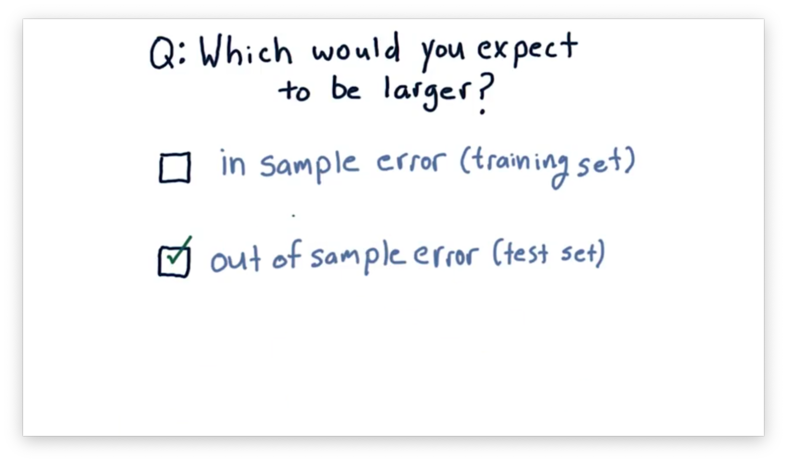
Which is Worse Quiz
Suppose we just built a model. Which error would you expect to be larger: in-sample or out-of-sample?
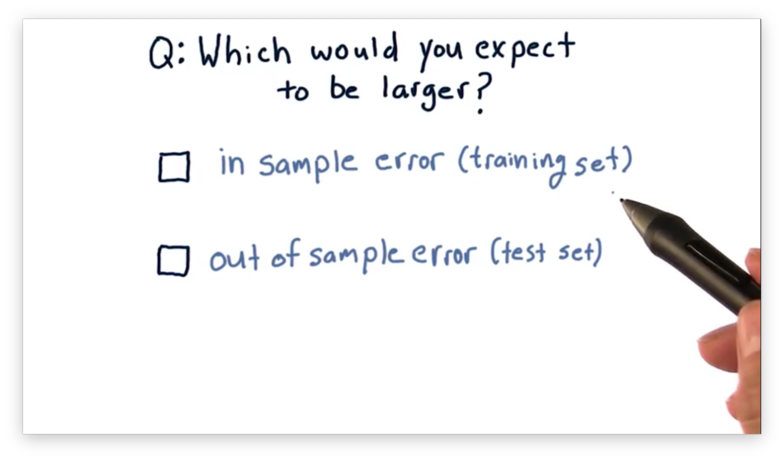
Which is Worse Quiz Solution
In general, the out-of-sample error is worse than the in-sample error.
Correlation and RMS Error Quiz
Let's think about the relationship between RMS error and the correlation between and . Which of the following statements is true?
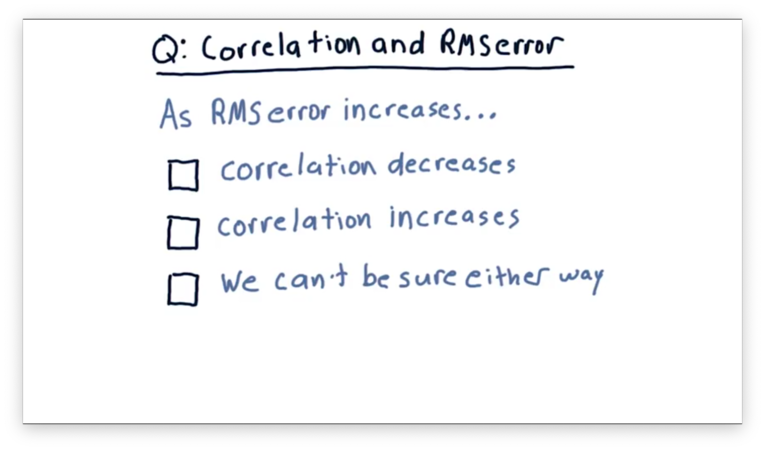
Correlation and RMS Error Quiz Solution
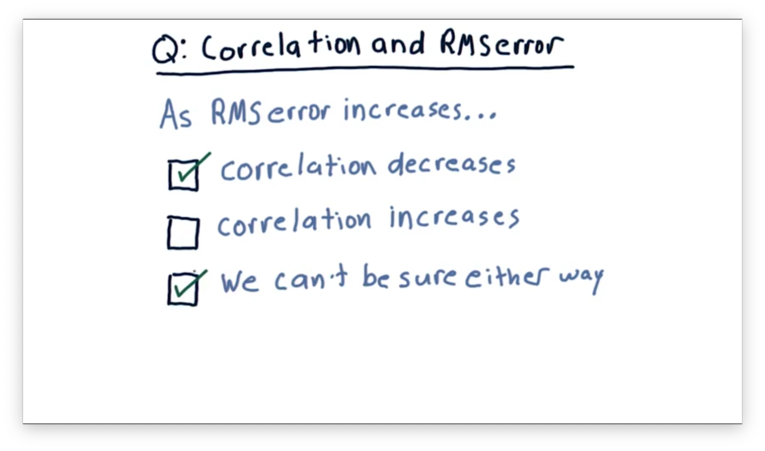
In most cases, correlation decreases as RMS error increases. However, it is possible to construct examples where correlation increases as RMS error increases.
Overfitting Quiz
Let's consider overfitting in KNN and how in-sample and out-of-sample error changes as increases from 1 to the number of items in a data set.
Which of the following plots correctly represents the shape of the error curves that we would expect for both types of error as we increase ?
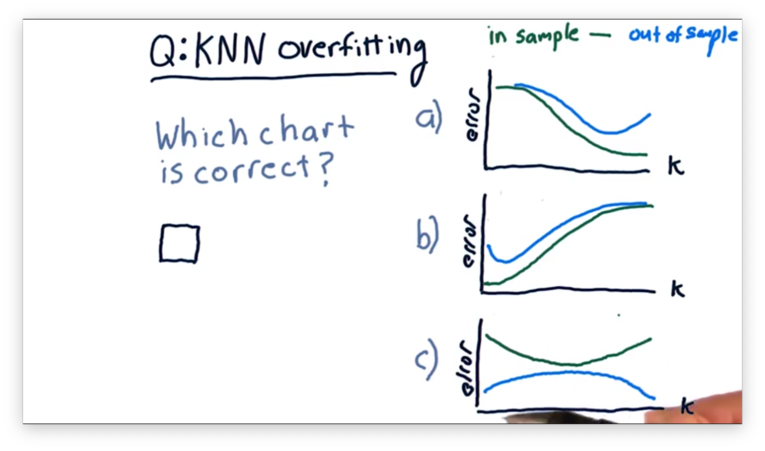
Overfitting Quiz Solution
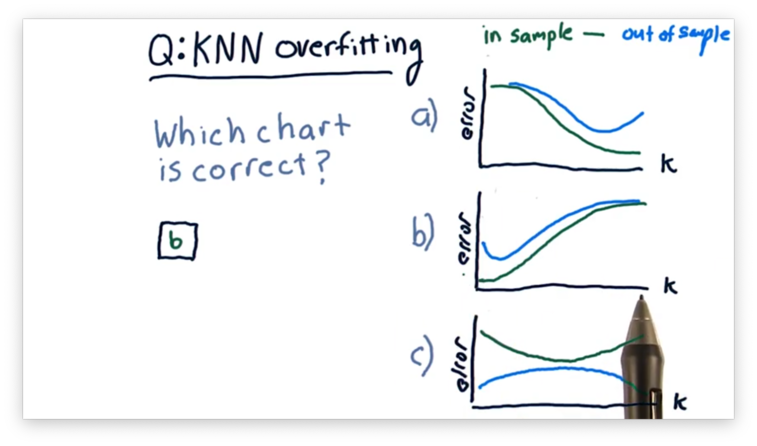
Remember that KNN models are least generalized when . In other words, when , the model predicts each training point in the data set perfectly but fails to predict testing points accurately. As a result, KNN models overfit when is small.
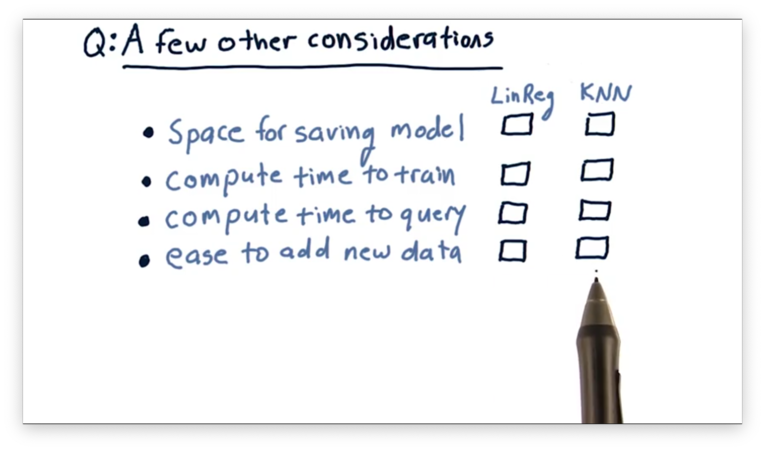
A Few Other Considerations Quiz
There are a few other factors worth considering when evaluating a learning algorithm. For each of the following factors, which of the two models has better performance?
A Few Other Considerations Quiz Solution
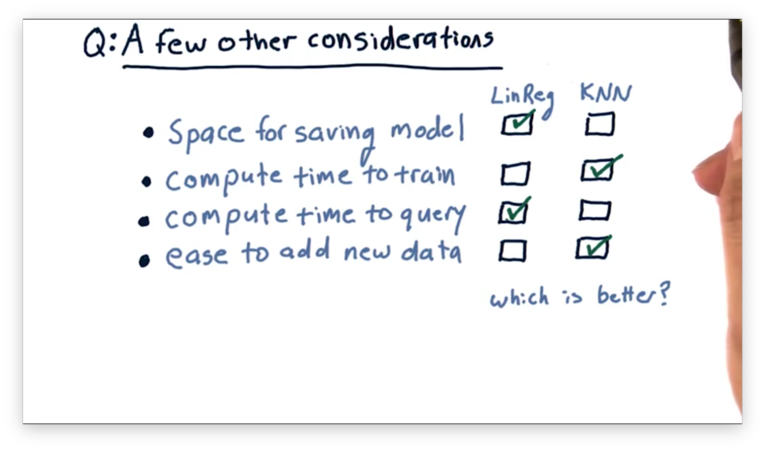
Linear regression models require less space for persistence than KNN models. A linear regression model of degree four can be described in as few as four integers, while a KNN model must retain every single data point ever seen.
KNN models require less compute time to train than linear regression models. In fact, KNN models require zero time to train.
Linear regression models process queries more quickly than KNN models. The query time for a linear regression model is constant. The query time for KNN models grows with the number of queries, as previously queried data points are added to the data set and must be examined in subsequent queries.
Adding new data is quicker in KNN than in linear regression. Incorporating new data into a model requires retraining the model, but, as we just saw, the training time for a KNN model is zero.
Ensemble Learners, Bagging, and Boosting
How to Build an Ensemble Quiz
How might we go about building an ensemble of learners?
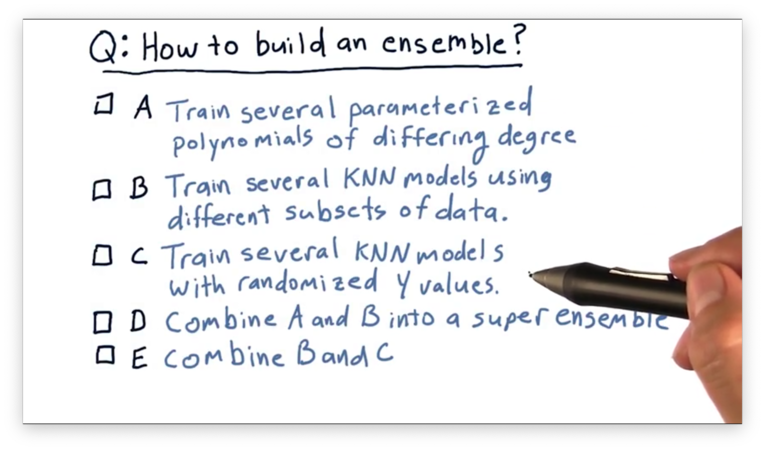
How to Build an Ensemble Quiz Solution
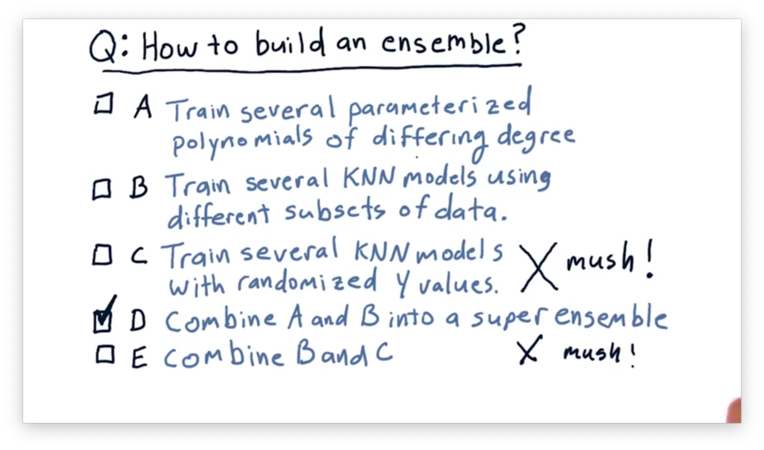
We can create an ensemble by training several parameterized polynomials of differing degrees (A) or by training several KNN models using different subsets of data (B).
It doesn't make sense to train KNN models using randomized -values, because we want to train any model we plan to use on the actual data in our training set. As a result, neither (C) nor (E) is correct.
Instead of using just polynomial learners or KNN learners, we can combine the two into a super ensemble (D) for even better results.
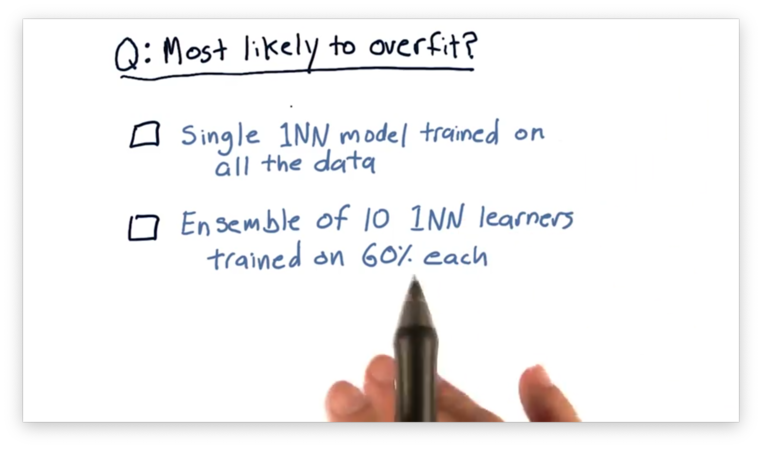
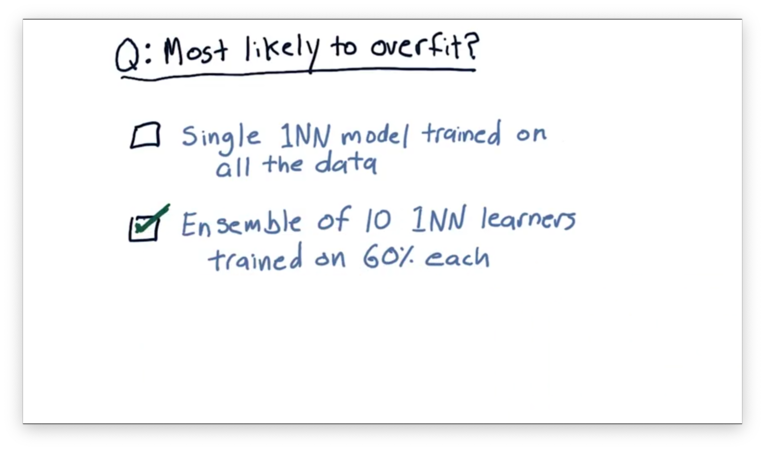
Overfitting Quiz
Which of these two models is least likely to overfit?
Aside: the screenshot says "most likely to overfit", but he selects the model that is least likely to overfit.
Overfitting Quiz Solution
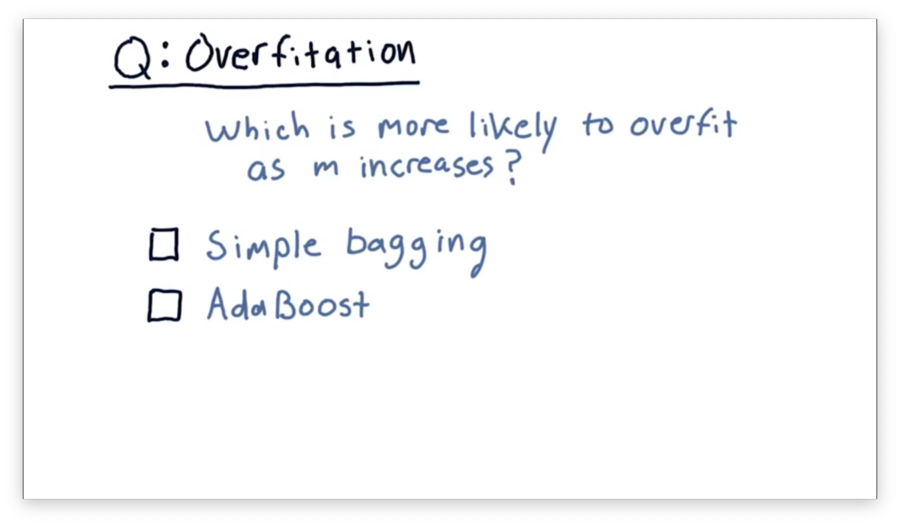
Overfitation Quiz
As we increase the number of models in our ensemble, which of the following strategies is more likely to overfit?
Overfitation Quiz Solution
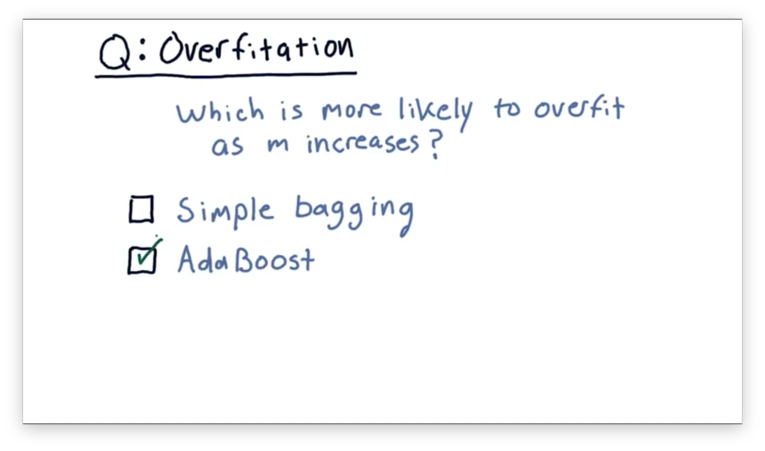
AdaBoost focuses primarily on improving the system for specific data points; in other words, it strives to fit. As a result, it is more susceptible to overfitting than is simple bagging.
So You Want to be a Hedge Fund Manager
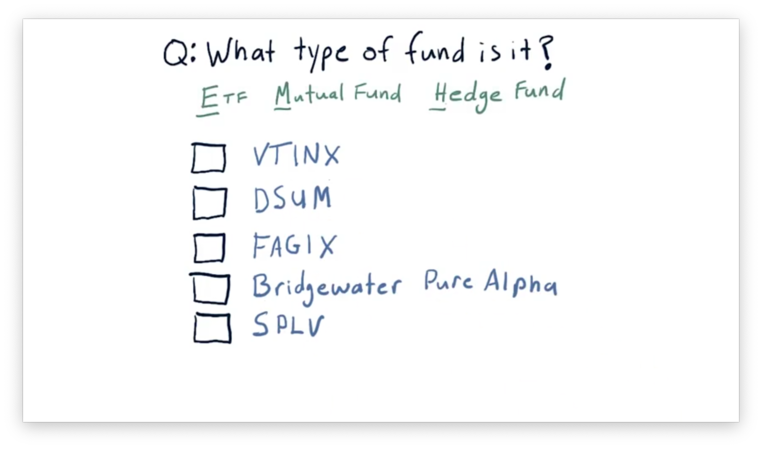
What Type of Fund is it Quiz
For each of the following five funds, determine if the fund is an ETF, mutual fund, or hedge fund. Use Google Finance or Yahoo Finance for help.
What Type of Fund is it Quiz Solution
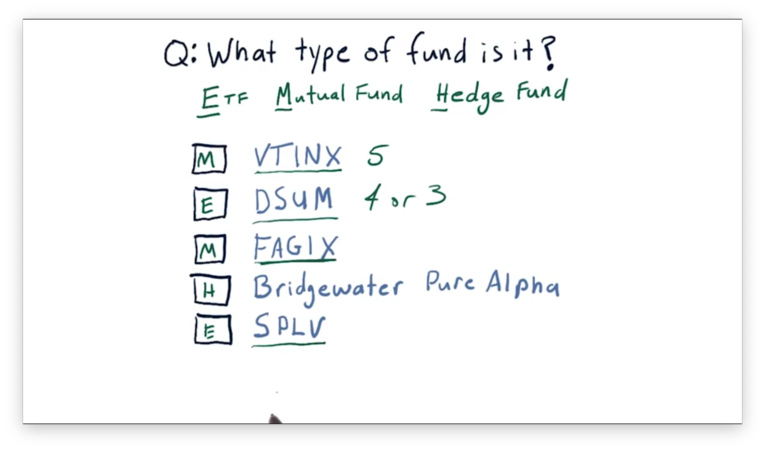
Typically, symbols for ETFs have three or four letters, while mutual fund symbols usually have five. Hedge funds don't have symbols; instead, we refer to them by their full name.
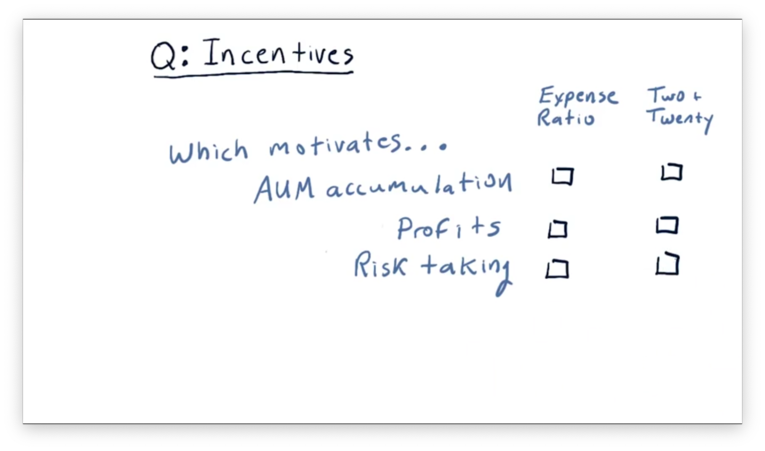
Incentives Quiz
So far, we've looked at two different incentive structures: expense ratios and the two and twenty rule. Which of the following actions might these compensation mechanisms incentivize?
Incentives Quiz Solution
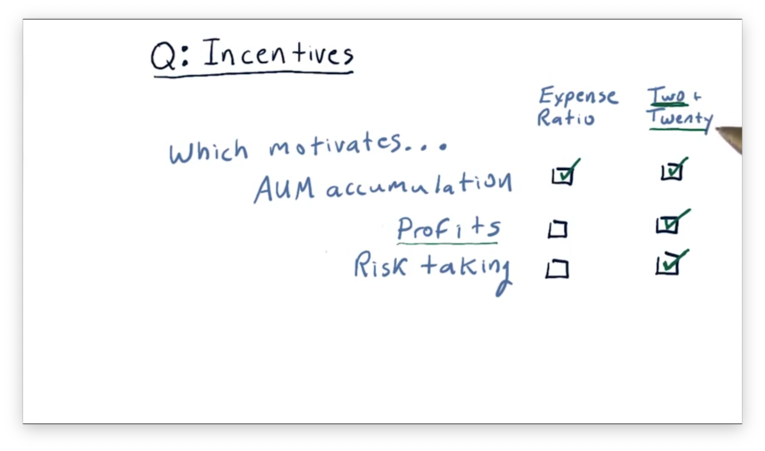
The expense ratio, which is derived entirely from AUM, primarily incentivizes AUM accumulation. Additionally, since the "two" of two and twenty is based on AUM, that incentive structure overall slightly incentivizes AUM accumulation.
ETF managers and mutual fund managers are not compensated for making profits. ETFs, for example, are specifically designed to track an index, and they don't particularly care whether an index goes up or down. The two and twenty rule incentivizes profit, as the "twenty" component is earned through profit gains.
Funds that compensate according to expense ratios are not incentivized to take risks at all. Under the two and twenty model, however, risk-taking is incentivized since significant profit gains can be realized by undertaking considerable risk.
Additionally, fund managers under the two and twenty rule are insulated from risk by the 2% expense ratio that they receive no matter what. As a result, they experience the upside of risk and a minimized downside.
Market Mechanics
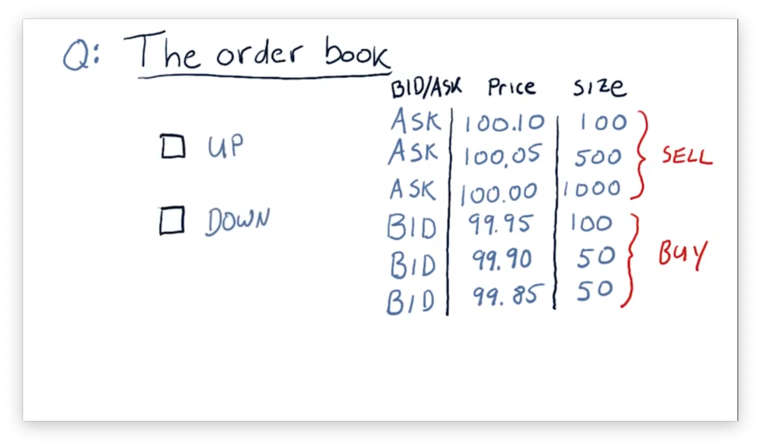
Up or Down Quiz
Consider the following order book. Do you think the price of this equity is likely to go up or down in the near future?
Up or Down Quiz Solution
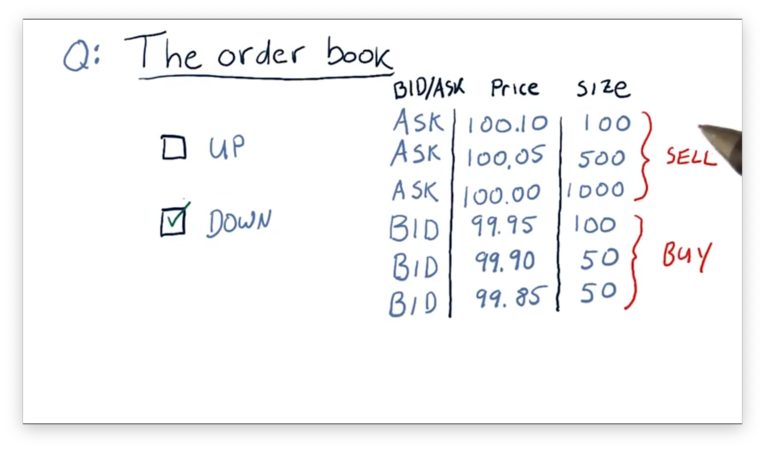
The price is likely to drop in the near future because there is more selling pressure than buying pressure.
Consider what would happen if we put in a market order to sell 200 shares. We would get 100 shares at $99.95, 50 shares at $99.90, and 50 shares at $99.85. Our single order would cause the price of the equity to drop by $0.10.
On the other hand, suppose we issue a market order to buy 200 shares. We would receive 200 of the 1000 shares available for sale at $100. The next market buy order would start with the remaining 800 shares for sale at $100. In other words, our buy order wouldn't affect the sale price at all.
Short Selling Quiz
Suppose we've been watching IBM, and we decide to short it when it reaches $100 because we think that it is going to go down. If we short 100 shares at $100 per share and submit an order to buy back the shares at $90 per share to close out our position, what is our net return?
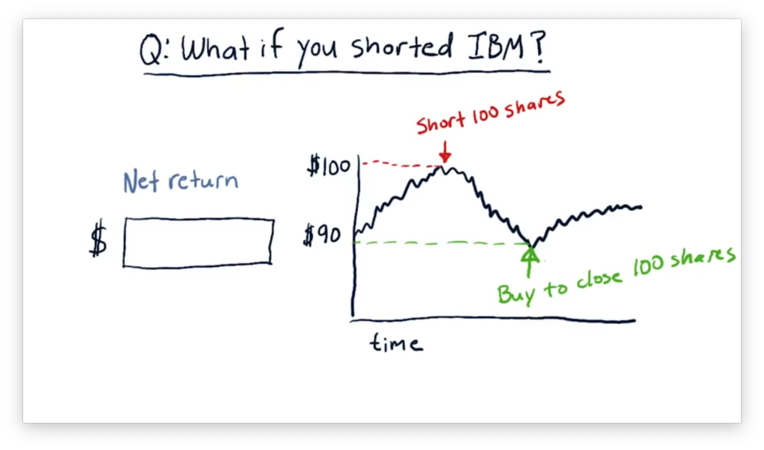
Short Selling Quiz Solution
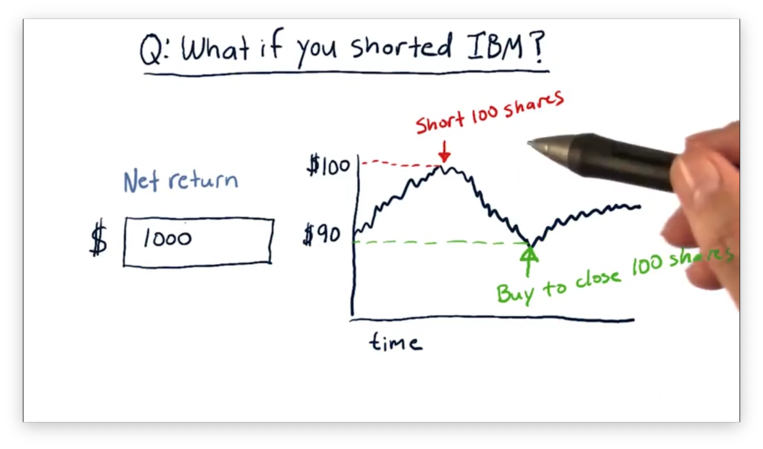
Each time IBM drops $1 in price, we make $100 because we are shorting 100 shares. Altogether, the stock dropped $10, so we made $1000.
What Is a Company Worth
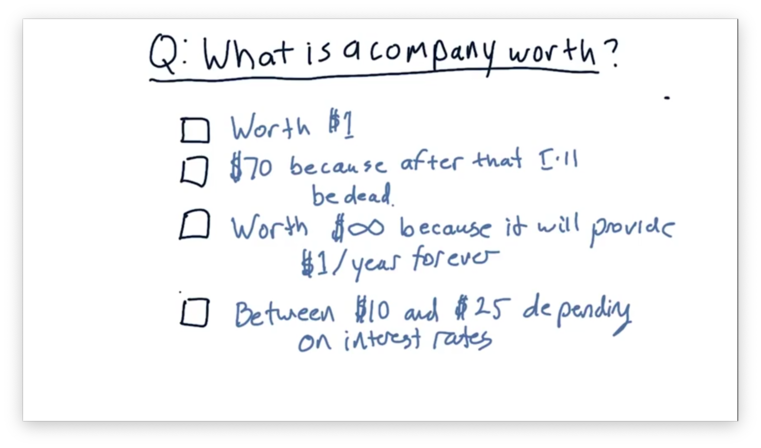
What Is a Company Worth Quiz
Suppose there is a company that consistently generates $1 per year. What is that company worth?
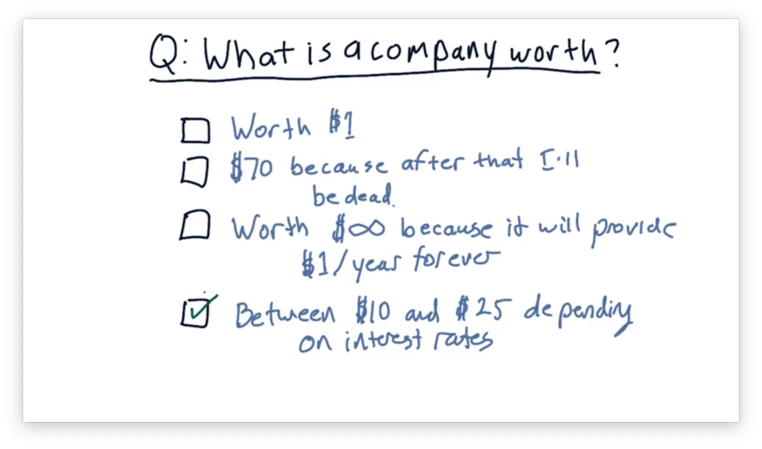
What Is a Company Worth Quiz Solution
The Balch Bond Quiz
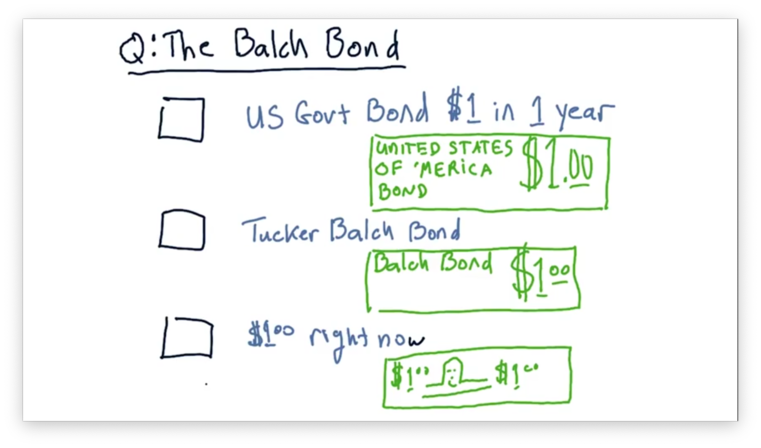
Assume that we are in a position to receive one of three different assets.
The first asset is a $1 bill: cold, hard cash. The second asset is a Tucker Balch bond; essentially, a promise certified by the professor that he will pay us $1 in one year. The third asset is a US Government bond, which also pays out $1 in one year, but is backed by the United States government.
Which of these assets would you rather receive? Rank the choices from 1 (best) to 3 (worst).
The Balch Bond Quiz Solution
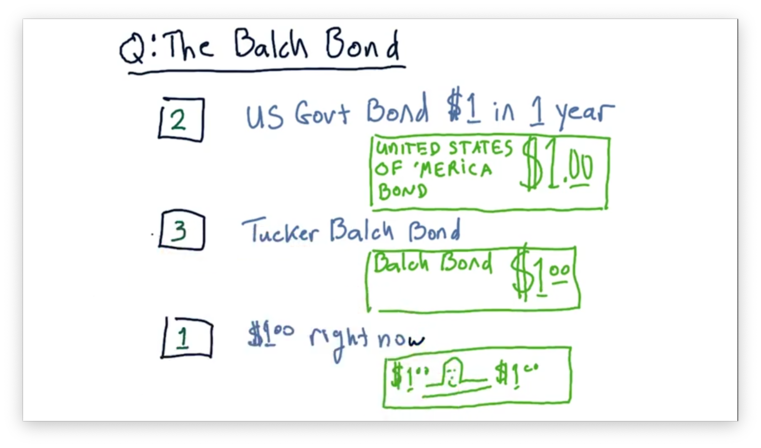
The most valuable asset among these three is the $1 delivered right now because you can spend it right now. The other two are promises for a reward at some point in the future. Among these two bonds, the one backed by the US government is likely more valuable than the one backed by the professor.
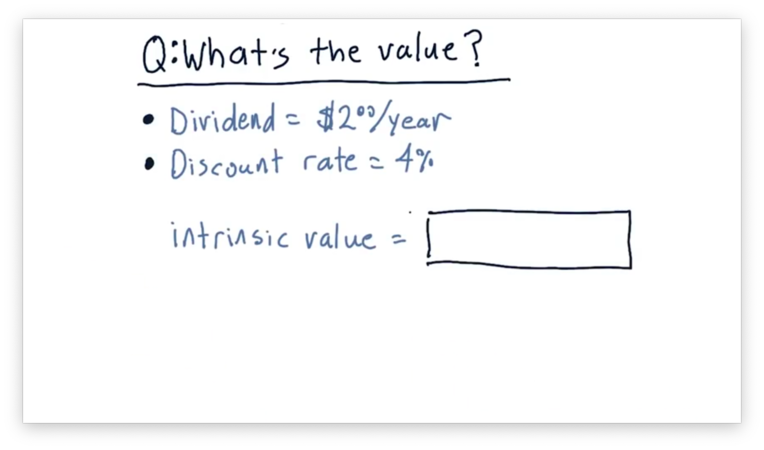
Intrinsic Value Quiz
Consider a company that pays a dividend of $2 per year. Given a discount rate of 4%, what is the intrinsic value of this company?
Intrinsic Value Quiz Solution
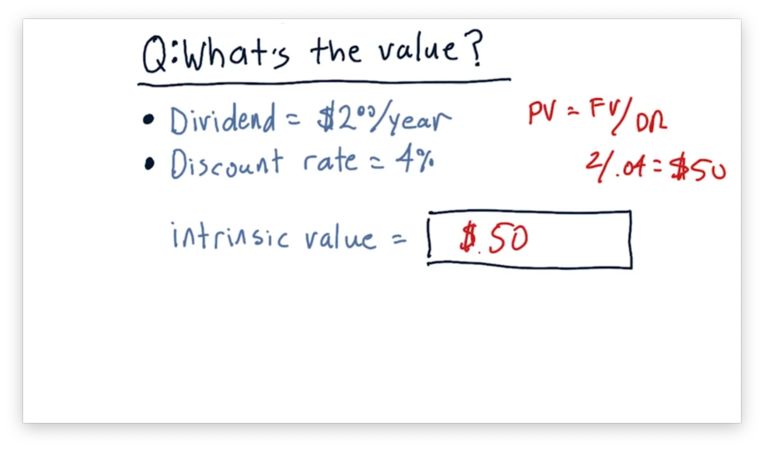
The present value, , of a company is equal to the future value, , divided by the discount rate, . Given and ,
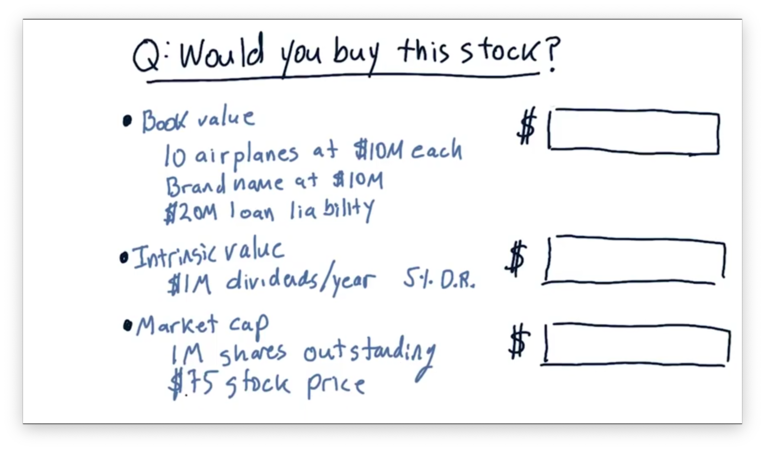
Compute Company Value Quiz
Consider a fictitious airline company.
This company owns 10 airplanes, each valued at $10 million. Additionally, it has a brand name worth another $10 million. Finally, it has an outstanding loan for $20 million. What is the book value of this company?
This company pays $1 million per year in dividends. Assuming a 5% discount rate, what is the intrinsic value of this company?
This company has one million shares of stock outstanding. Given a stock price of $75 per share, what is the market capitalization of this company?
Compute Company Value Quiz Solution
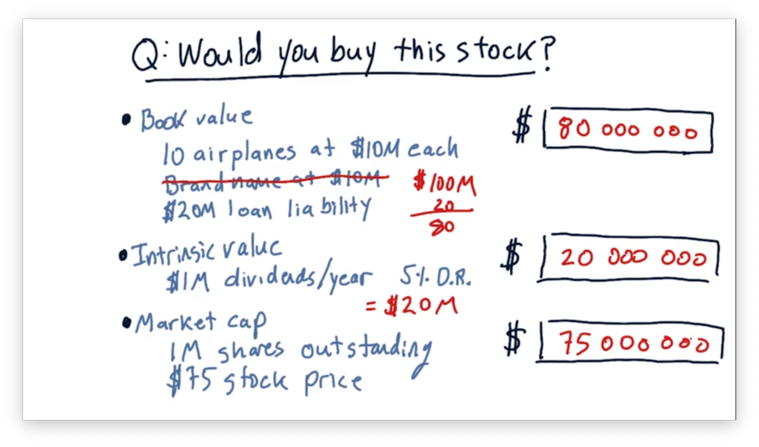
To calculate book value, we take the value of the total assets and subtract the intangible assets, like the brand, and the liabilities. Given $110,000,000 in total assets, a $10,000,000 intangible asset, and a $20,000,000 liability, the book value for this company is $80,000,000.
To compute the intrinsic value, we divide the value of the dividends, $1,000,000, by the discount rate, 0.05, to get $20,000,000.
To compute the market capitalization, we take the product of the share price, $75, and the number of outstanding shares, 1,000,000, to get $75,000,000.
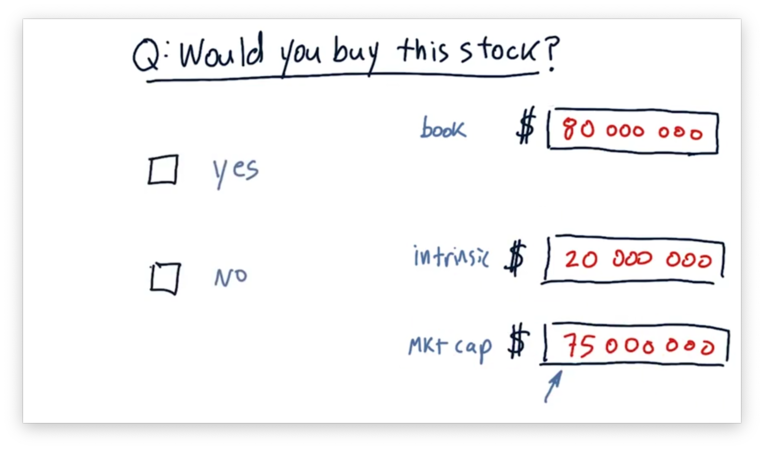
Would you Buy this Stock Quiz
Since this company has a market capitalization of $75,000,000, we could buy all of the shares and, effectively the company, for $75,000,000. Should we?
Would you Buy this Stock Quiz Solution
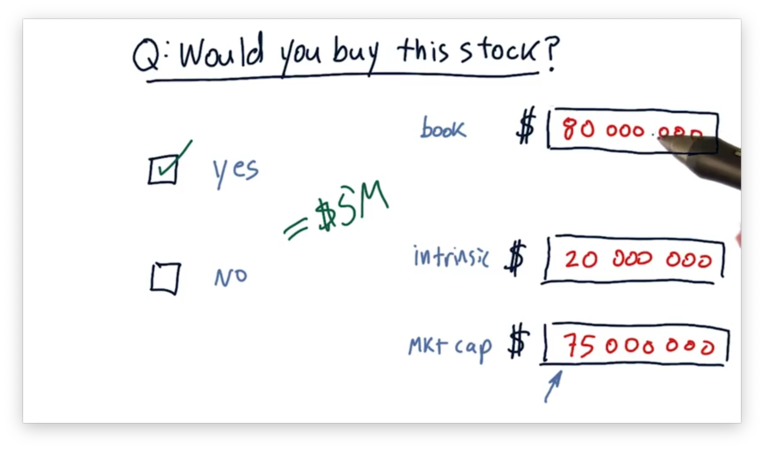
It might seem like a tricky question, given such a relatively low intrinsic value, but it's not. We should buy this company for $75,000,000 and then break it apart and sell the individual assets for $80,000,000 to get an immediate $5,000,000 profit.
Stock prices very rarely dip below book value for this exact reason; otherwise, predatory buyers swoop in and buy the whole company just to sell it for parts.
The Capital Assets Pricing Model (CAPM)
Portfolio Return Quiz
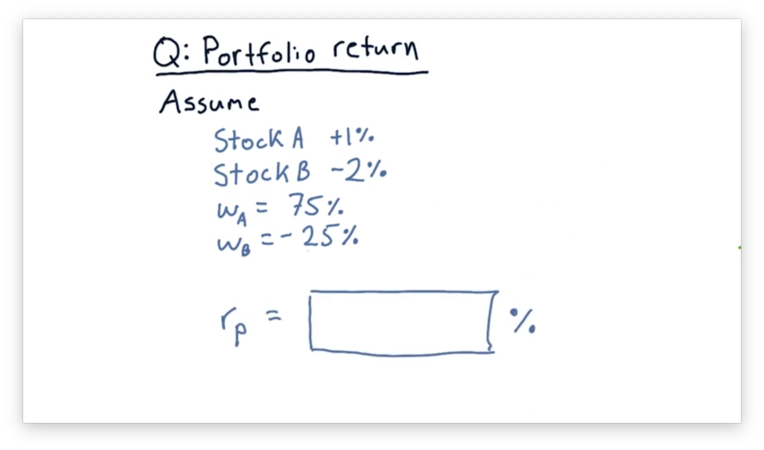
Consider a portfolio consisting of two stocks: Stock A and Stock B. 75% of the portfolio is in Stock A, and -25% of the portfolio is in Stock B; in other words, the portfolio has taken a short position in Stock B.
Assume that, today, the price of Stock A increases by 1%, while the price of Stock B decreases by 2%. What is the return on this portfolio?
Portfolio Return Quiz Solution
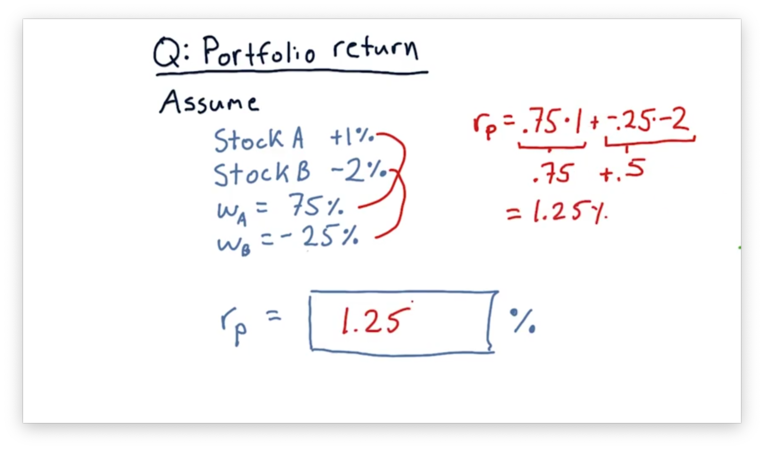
Remember the formula to calculate portfolio return.
If we plug in the weights and returns for Stock A and Stock B, we can compute a portfolio return of 1.25%.
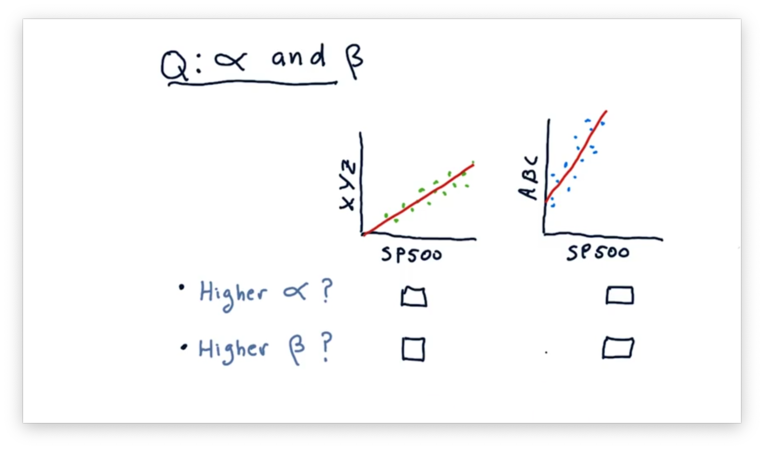
Compare Alpha and Beta Quiz
Consider the following two scatterplots. The plot on the left shows the daily returns of a fictional stock XYZ against the daily returns of the S&P 500. The plot on the right shows the daily returns of a fictional stock ABC against the daily returns of the S&P 500.
Given these two plots, which asset has a higher and which has a higher ?
Compare Alpha and Beta Quiz Solution
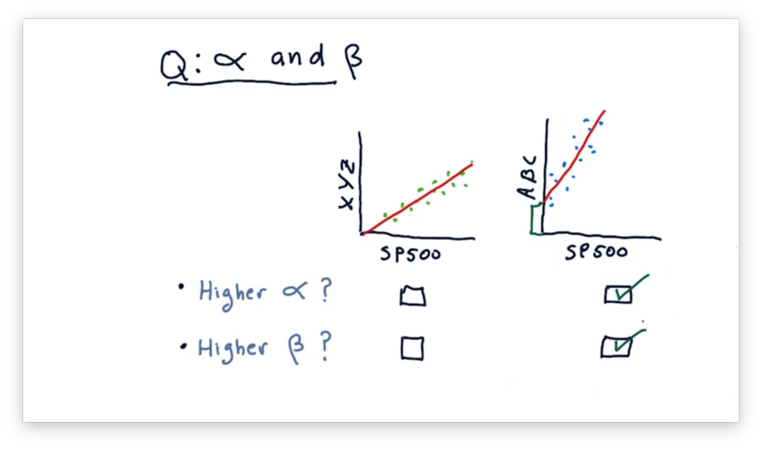
Recall that is the slope of the fit line, and is the y-intercept of the fit line. We can tell from the plots that ABC has both a higher and a higher .
Implications of CAPM Quiz
If we are in an upward market, do we want a portfolio with a larger or a smaller ? How about if we are in a downward market?
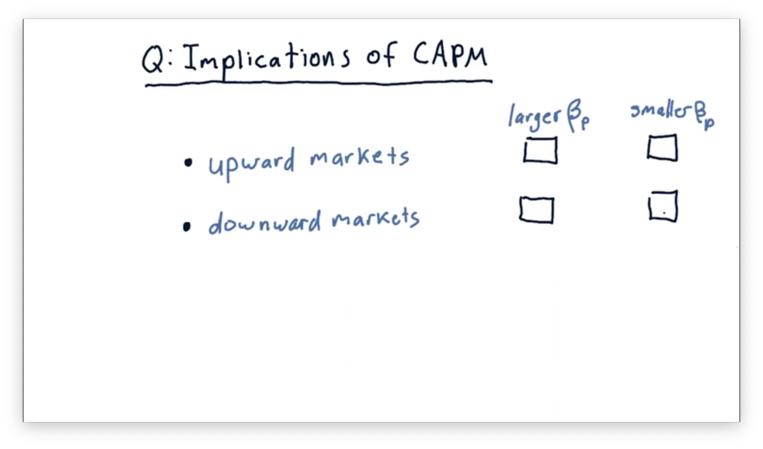
Implications of CAPM Quiz Solution
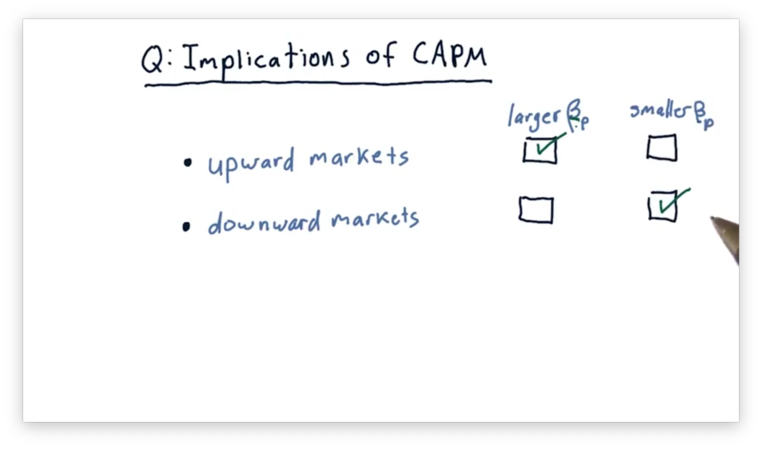
In upward markets, we want a portfolio with a larger . For example, a portfolio with a greater than one rises even higher than the market, while a portfolio with a smaller than one won't be able to take full advantage of market performance.
In downward markets, we want the opposite: a smaller . Indeed, a portfolio with a smaller falls less sharply in a downward market, while a portfolio with a larger crashes hard.
How Hedge Funds Use the CAPM
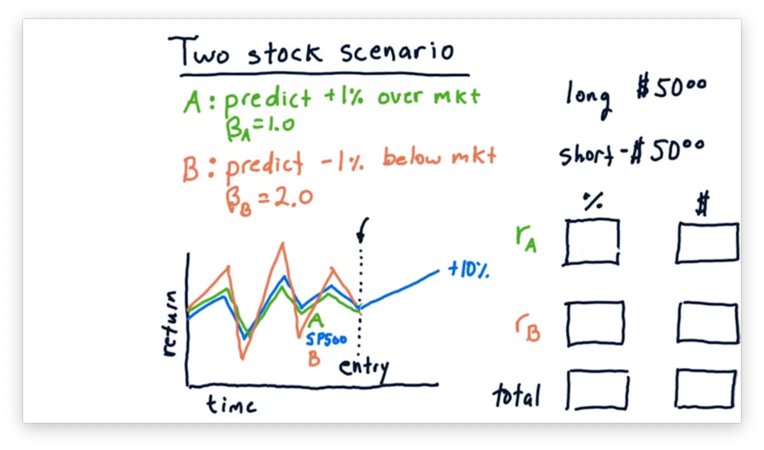
Two Stock Scenario Quiz
Let's consider another scenario now.
Instead of staying flat, suppose that the market went up 10%. What are the relative and absolute returns for both stocks, and what is our total return, both relative and absolute?
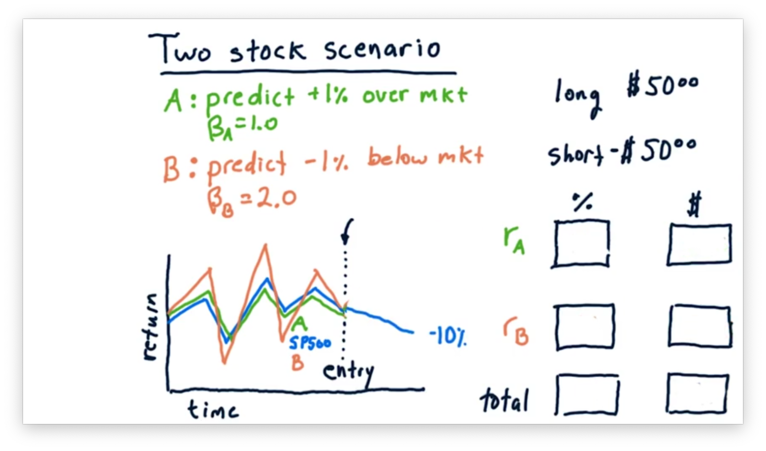
Let's also consider the scenario where the market goes down 10%. What are the relative and absolute returns for both stocks, and what is our total return, both relative and absolute?
Two Stock Scenario Quiz Solution
Let's first look at the case where the market rises by 10%.
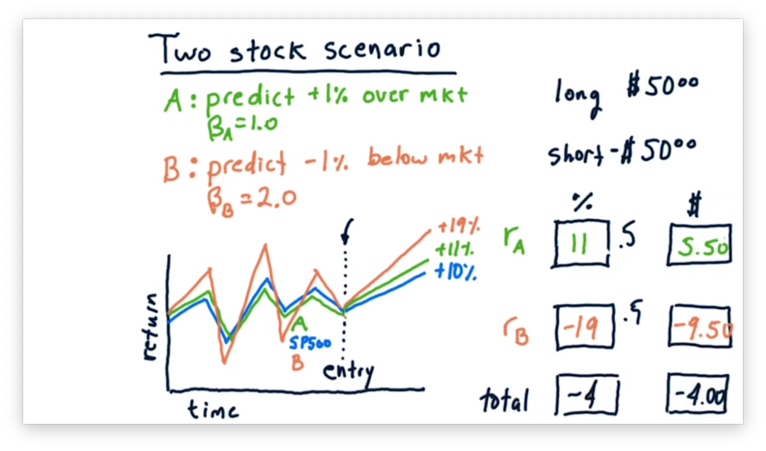
Consider stock A, which has a of 1.0 and an of 0.01. A of 1.0 tells us that for every percentage point that the market moves, stock A moves one percent. An of 0.01 tells us that stock A will move 1% above its movement with the market.
As a result, stock A moves 10% plus 1%, for a total relative return of 11%, and a total absolute return of $5.50, 11% on a $50 investment.
Let's consider stock B now, which has a of 2.0 and an of -0.01. A of 2.0 tells us that for every percentage point the market moves, stock A moves two percent. An of -0.01 tells us that stock B will move 1% below its movement with the market.
As a result, stock B moves 20% minus 1%, for a total relative return of 19%. However, since we shorted stock B, this return is actually -19%, and we have lost $9.50.
Let's compute the total return. Since we gained $5.50 on stock A and lost $9.50 on stock B, our total absolute return is -$4.
Calculating the relative return is a little tricky; that is, we can't just add 11% and -19% to get -8%. Instead, since we split our investment across stock A and stock B, our actual return is one-half of 11% plus one-half of -19%, or -4%.
Now, let's look at the case where the market falls 10%.
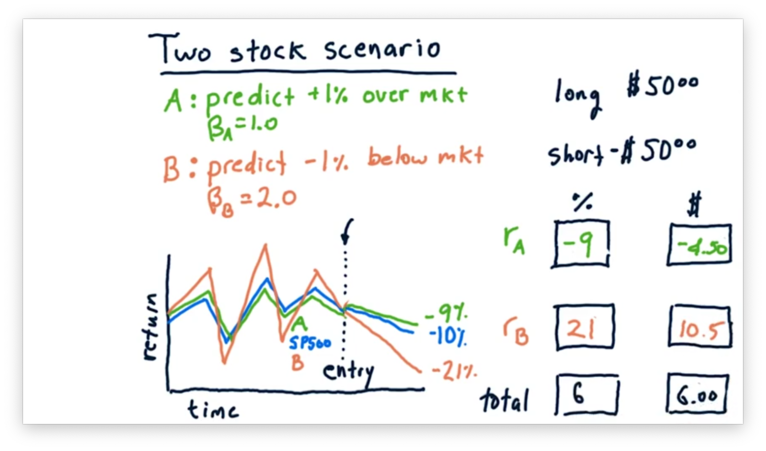
In this case, stock A falls with the market, but does 1% better, for a total relative loss of 9%, which equates to a $4.50 loss on a $50 investment.
Stock B falls twice as hard as the market, and does 1% worse on top of that, for a total relative loss of 21%. However, since we shorted stock B, this loss is actually a 21% gain, or a gain of $10.50 on a $50 investment.
Overall, this market scenario nets us 6%, or $6 on a $100 investment.
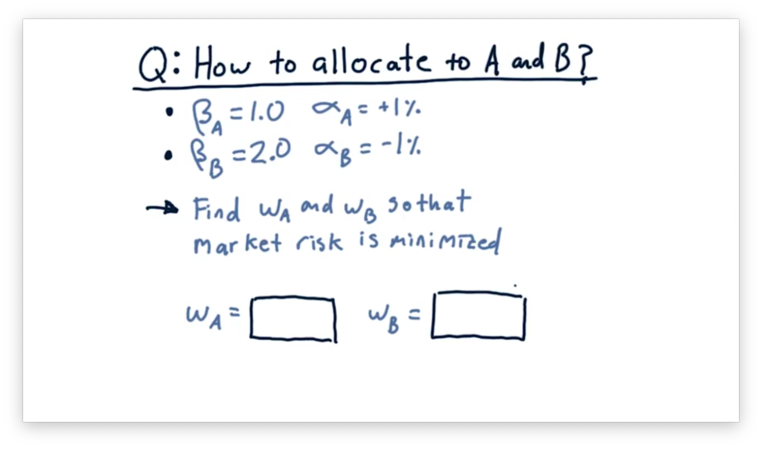
Allocations Remove Market Risk Quiz
Let's look at our two stocks again. Stock A has a of 1.0 and an of 0.01. Stock B has a of 2.0 and an of -0.01. What should the weights be for stock A and stock B so that we can minimize market risk?
Allocations Remove Market Risk Quiz Solution
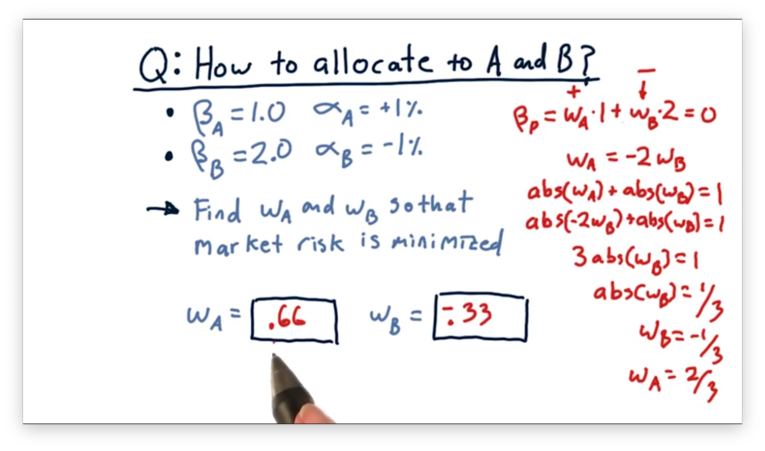
We need to solve the following equation.
We also know that the sum of the absolute values and should equal one.
If we substitute for , we can solve for .
However, since we want to short B, is actually , not . We can now solve for .
If we plug these two weights back into our original equation, we can verify that we do get an overall of 0.
Technical Analysis
Potential Indicators Quiz
Now that we know some differences between the types of data used for fundamental and technical analysis, let's look at the following four factors. Which of these are fundamental, and which are technical?
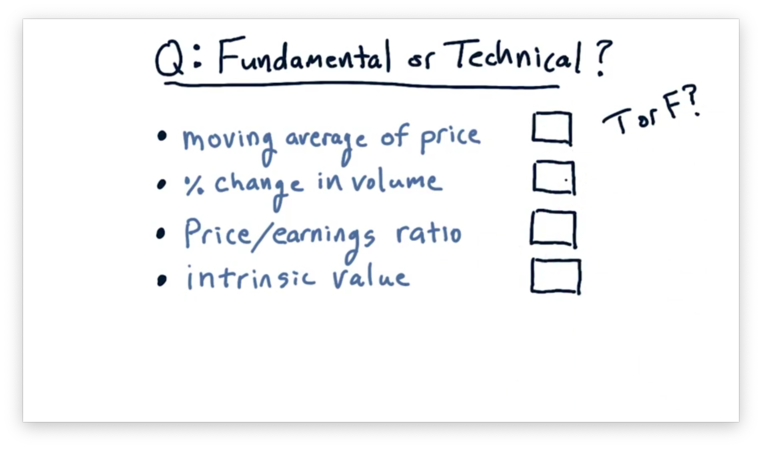
Potential Indicators Quiz Solution
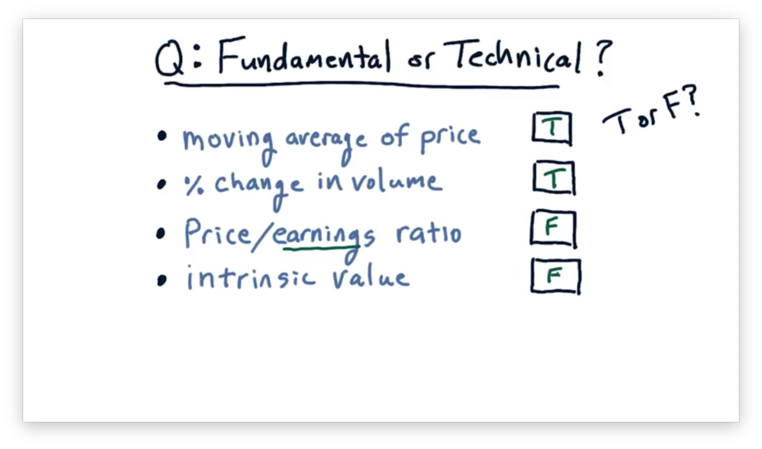
Remember that technical analysis considers only price and volume data, whereas fundamental analysis incorporates other types of data.
The moving average of price and the percent change in volume consider only price and volume, respectively, so they are both technical indicators.
P/E ratio considers both price and earnings, making it a fundamental factor, as well as intrinsic value, which is based on dividends
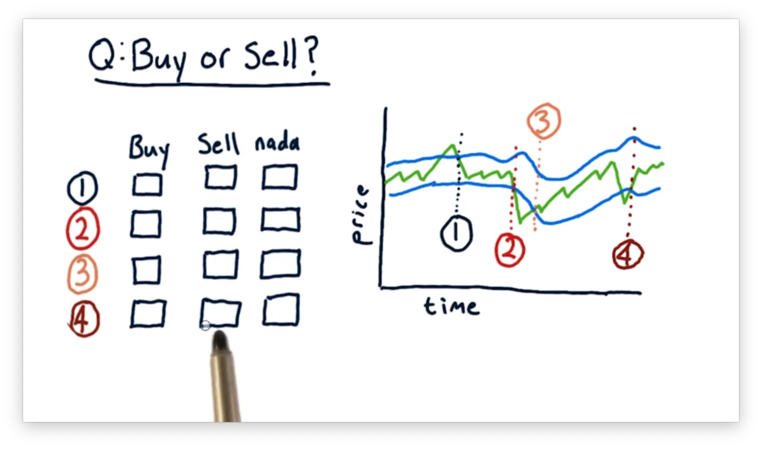
Buy or Sell Quiz
Let's consider how we might trade using Bollinger Bands. Consider the four events below, each of which involves the price of a stock crossing over a Bollinger Band. For each event, determine if the event demonstrates a buying opportunity, a selling opportunity, or no opportunity at all.
Buy or Sell Quiz Solution
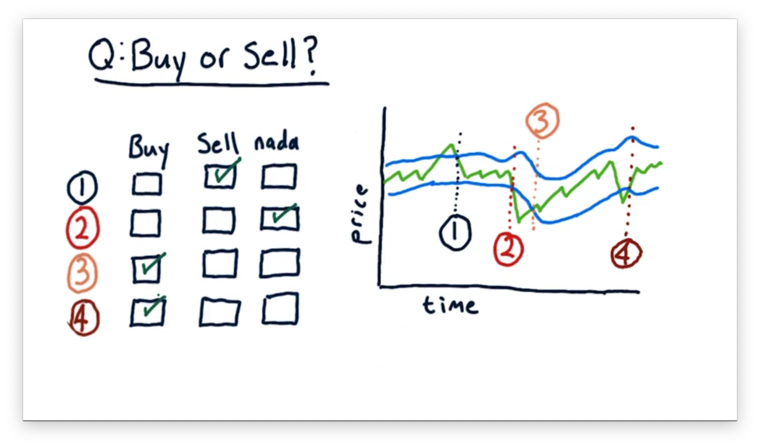
For the first event, we see the price crossing from the outside to the inside of the upper Bollinger Band. This event indicates that the price is moving back towards the moving average after a strong upward excursion. This is a sell signal.
For the second event, we see the price crossing from the inside to the outside of the lower Bollinger Band. This is not a signal, although it does indicate a significant excursion from the moving average.
For the third and fourth events, we see the price crossing from the outside to the inside of the lower Bollinger Band. These events indicate that the price is moving back towards the moving average after a strong downward excursion. Correspondingly, they are both buy signals.
Dealing With Data
Price Anomaly Quiz
Consider the following plot of IBM stock prices over time.
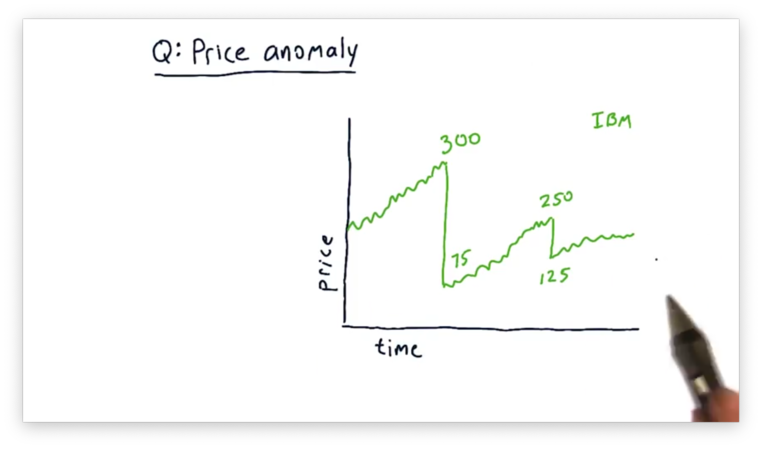
Notice the sudden drops in price. In one example, the price drops from $300 per share to $75 per share; in another, the price drops from $250 per share to $125 per share. These drops represent a 75% and a 50% price decline, respectively.
Undoubtedly, the value of IBM did not drop that much in one day, so, which of the following reasons might explain the sudden drop in stock price?
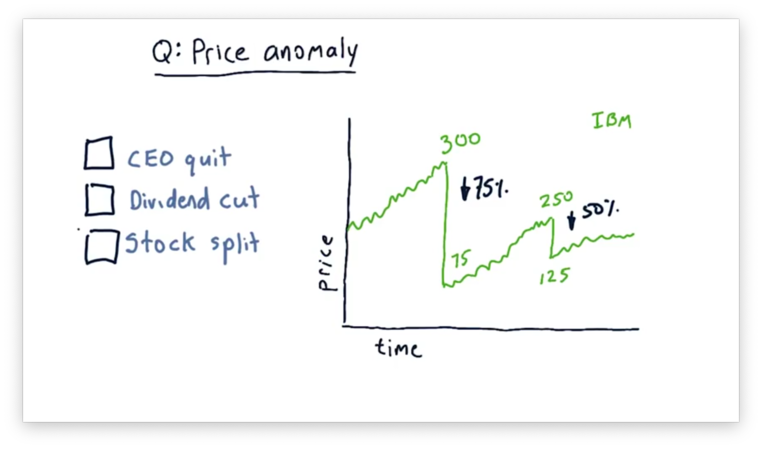
Price Anomaly Quiz Solution
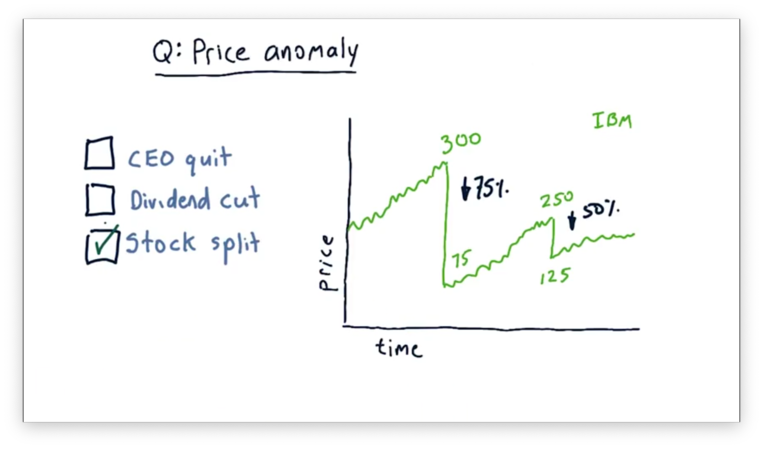
What we see here is a stock split, whereby a single share becomes shares, and the price of each share is divided by .
For example, consider the drop in price from $300 per share to $75 per share. This 75% drop in price is consistent with a 4-for-1 stock split, whereby one share becomes four shares. Note that the total value of the shares is preserved - four $75 shares still equals $300 worth of IBM - but the number of overall shares has increased.
Split Adjustment Quiz
Consider the following plot of close prices for a particular stock over time. Notice the 2:1 stock split. For each of the three days identified below, what is the adjusted close price for this stock?
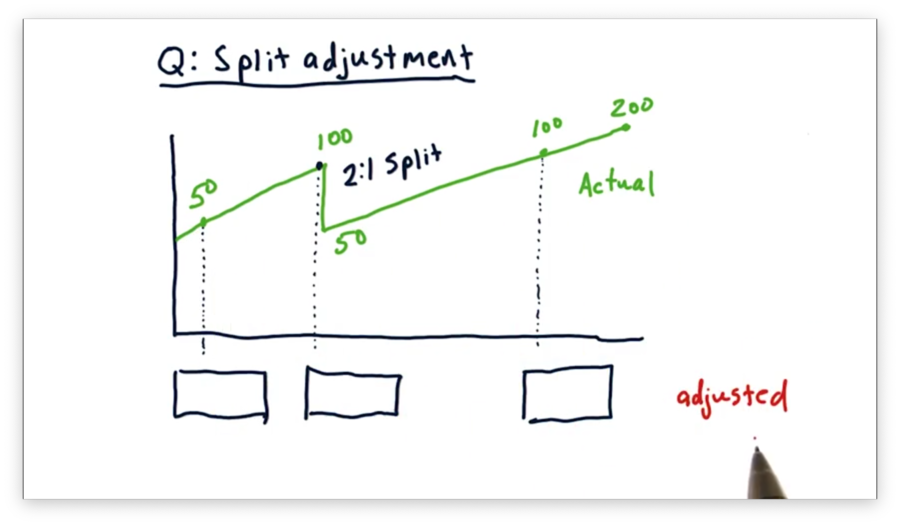
Split Adjustment Quiz Solution
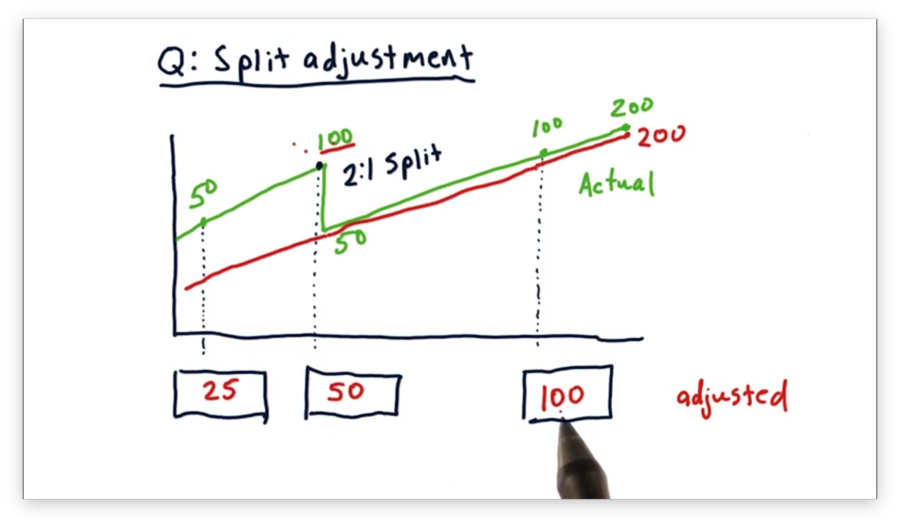
For each day since the stock split, the adjusted close is equivalent to the actual close. As a result, the adjusted close for the most recent of the three days is $100.
For all days before the 2:1 split, we calculate the adjusted close by dividing the actual close by two. As a result, the adjusted close prices for the previous two days, moving backward from the split, are $50 and $25, respectively.
Consider buying one share of stock, on the first of the three days, for $50. After the split, we would have two shares, each worth $50, and by the third day, our shares would be worth $100 apiece. This trajectory represents a four-fold increase in value, from $50 to $200 worth of stock.
Note that using the adjusted close accurately reflects this quadrupling of value, whereas the actual close seems to indicate, incorrectly, only a doubling of value.
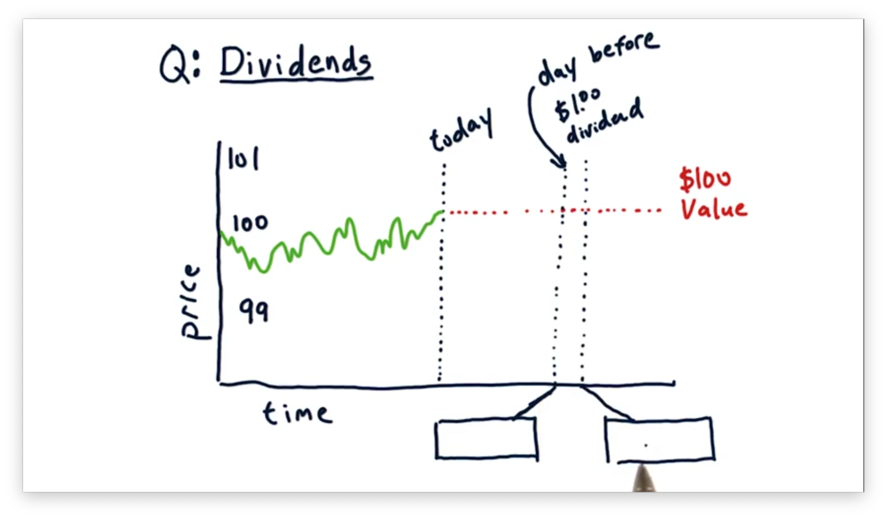
Dividends Quiz
What share price do we expect to see the day before the dividend is paid? How about after the dividend is paid?
Dividends Quiz Solution
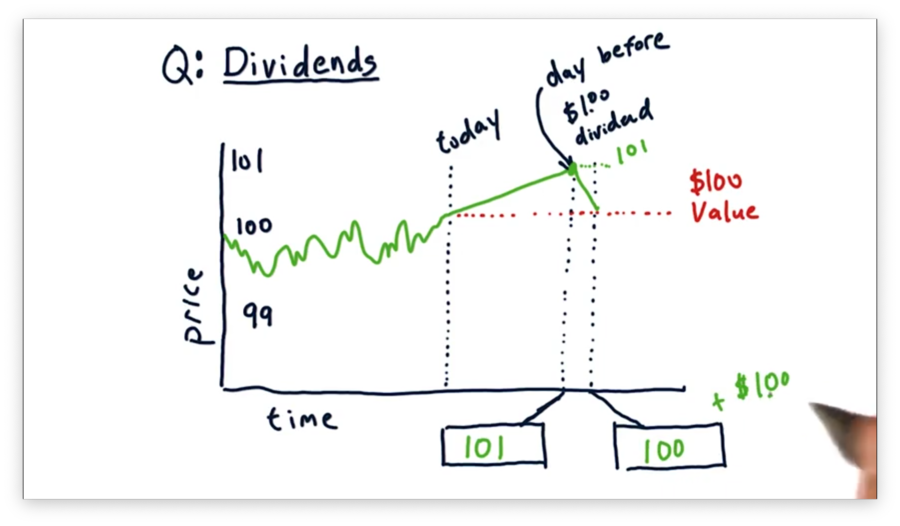
The day before the dividend is paid, we should expect to see the stock price rise to $101. A share price of $101 reflects the underlying value of $100 per share, for which there is consensus, plus the expected $1 dividend payment.
On the very next day, we should expect the price to drop by $1 to $100 per share. Since the dividend has been paid, the share price should drop back down to the price aligned with its fundamental value: $100 per share.
Note that the overall value for investors who bought before the dividend was paid is still $101 per share: $100 per share plus $1 in cash per share.
Efficient Markets Hypothesis
The EMH Prohibits Quiz
Consider the three forms of the efficient markets hypothesis: weak, semi-strong, and strong. Which forms prohibit which of the following different analyses?
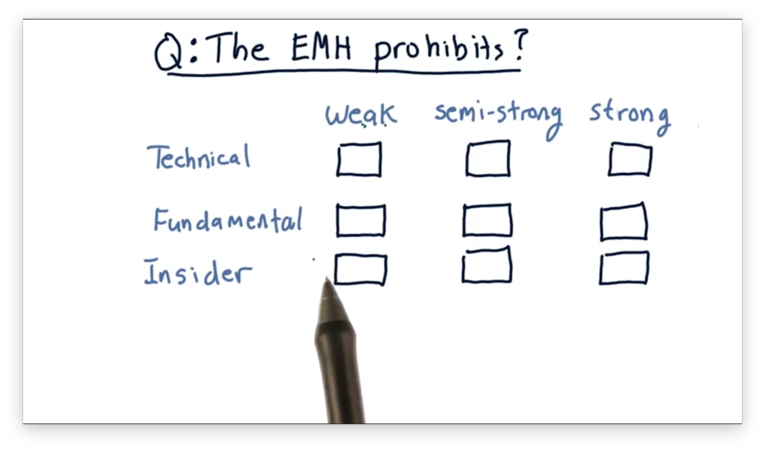
The EMH Prohibits Quiz Solution
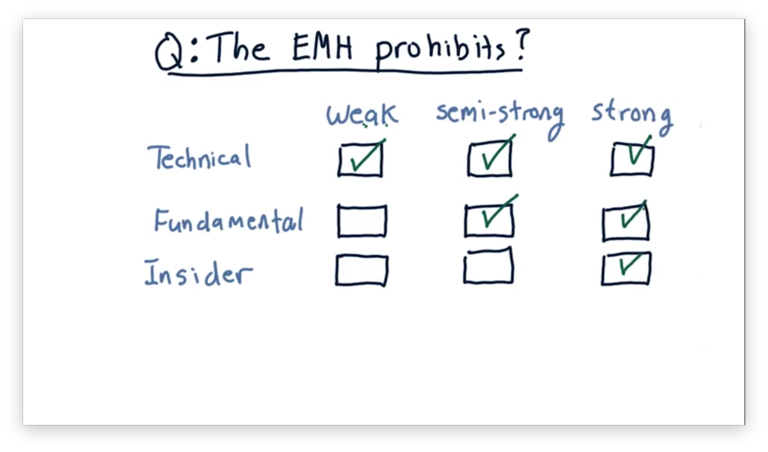
The weak version of the EMH prohibits us from profiting using technical analysis but is silent on fundamental analysis and insider knowledge. The semi-strong version prohibits technical and fundamental analysis but is silent on insider knowledge. The strong version prohibits all three.
The Fundamental Law of Active Portfolio Management
Which Bet is Better Quiz
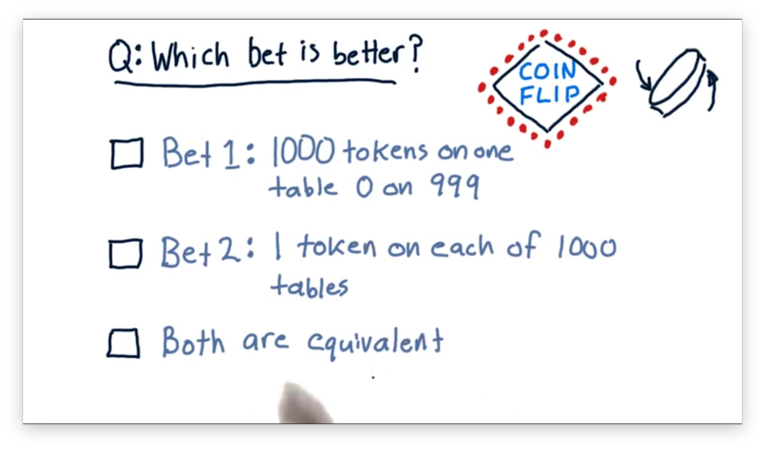
Let's consider two different ways to bet.
One approach is to put all 1000 tokens on one table and zero tokens on the other 999 tables. Another approach is to put one coin on each of the 1000 tables. Which of these approaches is better, or is it the case that they are equivalent?
Which Bet is Better Quiz Solution
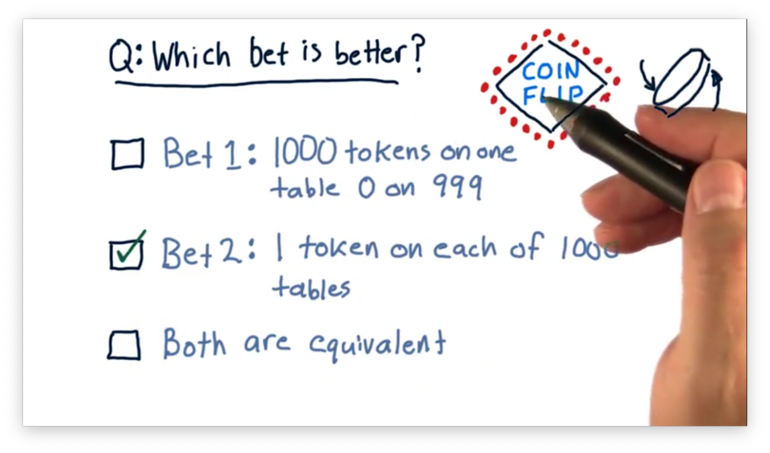
The first bet is very risky; that is, there is a 49% chance that we are going to lose all of our money with the single flip of a coin. The second bet is much less risky. By distributing our tokens across all one thousand tables, we only lose all of our money if we lose all 1000 bets: a very low probability indeed.
Since the expected return for each of these bets is the same, the second bet is a better choice from the perspective of risk-adjusted reward.
Coin-Flip Casino: Reward Quiz
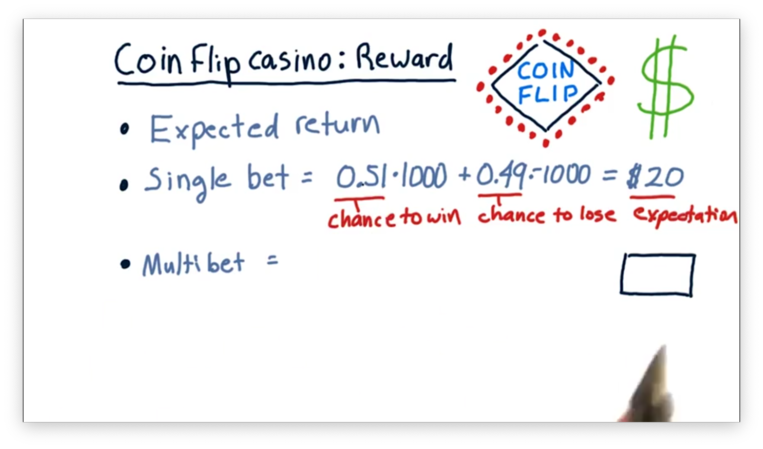
To figure out which of these different scenarios is best, we need to consider reward and risk. When we talk about reward in this situation, we are talking about expected return.
In the single-bet case, where we bet 1000 chips at once, our expected return is the chance of winning the bet times the amount that we would win plus the chance of losing the bet times the amount that we would lose.
Since we are using a biased coin, we have a 51% chance of winning 1000 tokens and a 49% chance of losing 1000 tokens. If we multiply this out, we see that our expected return is 20 tokens.
What is the expected return in the multi-bet case, where we bet 1000 tokens across 1000 different tables?
Coin-Flip Casino: Reward Quiz Solution
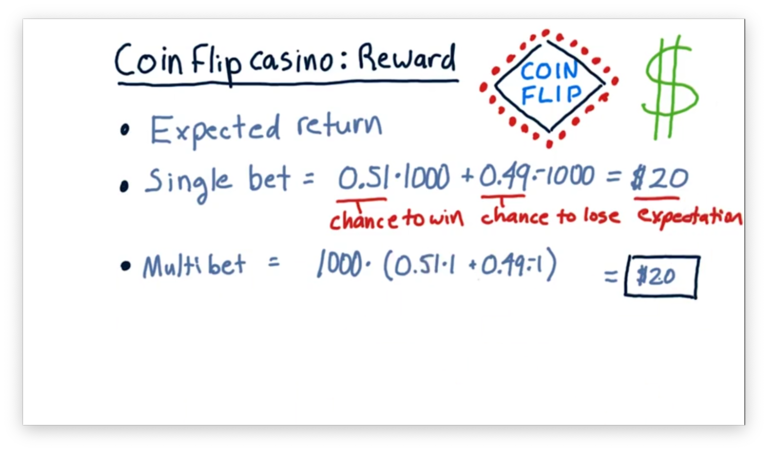
In this case, we have the same chances of winning and losing - 51% and 49%, respectively - but the amount we stand to win or lose on any bet is only one dollar. Since we are placing 1000 bets, our overall expected value is 1000 times the expected value of any individual bet.
Notice that for both the single-bet and multi-bet scenarios, the expected return - the reward - is precisely the same. To understand why the multi-bet setup is a better choice, we have to also consider the risk inherent in each scenario.
Coin-Flip Casino: Reward/Risk Quiz
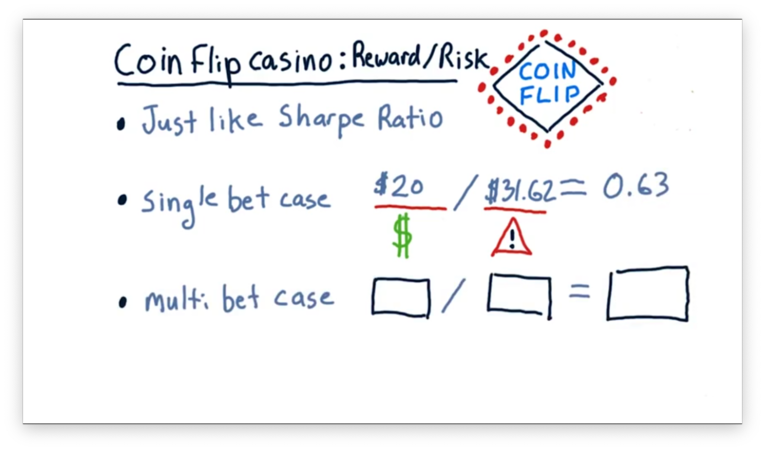
Now we can consider the risk-adjusted reward.
Let's look at the single-bet case first. In this case, the expected reward is $20, and the expected risk is $31.62. If we divide the reward by the risk, we get a value of 0.63.
What is the risk-adjusted reward calculation for the multi-bet case?
Coin-Flip Casino: Reward/Risk Quiz Solution
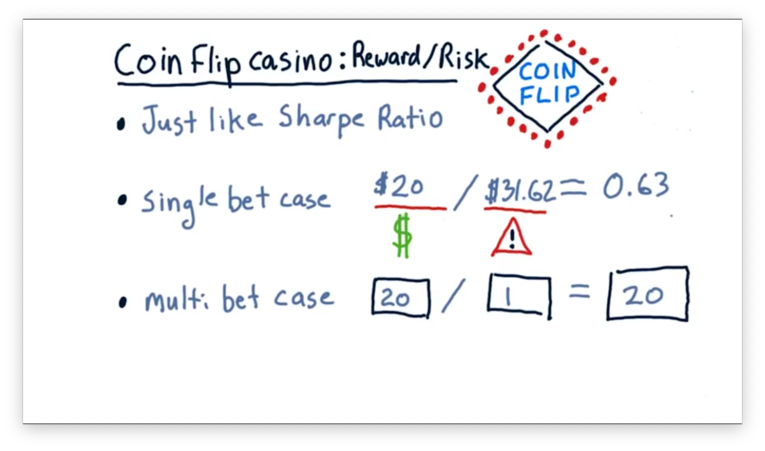
In the multi-bet case, the reward was the same - $20 - but the risk was much smaller: $1. Thus, the risk-adjusted reward for this scenario is 20, which is much higher than that of the single-bet scenario.
The take-home message here is that we can increase the risk-adjusted reward simply by spreading our money across a large number of bets.
Simons vs. Buffet Quiz
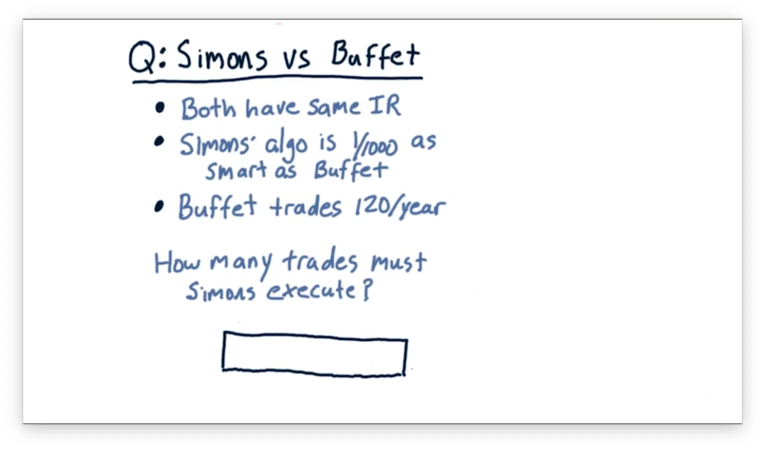
How can we relate the performance of Renaissance Technologies - really, Jim Simons - and Warren Buffett?
For this problem, let's assume that Simons and Buffett both have the same information ratio. Let's also assume that Simons's stock-picking algorithms are only about 1/1000th as smart as Buffett's; in other words, Simon's information coefficient is 1/1000th that of Buffett.
If Buffett trades 120 times a year, how many times must Simons trade to maintain the same information ratio as Buffett?
Simons vs. Buffet Quiz Solution
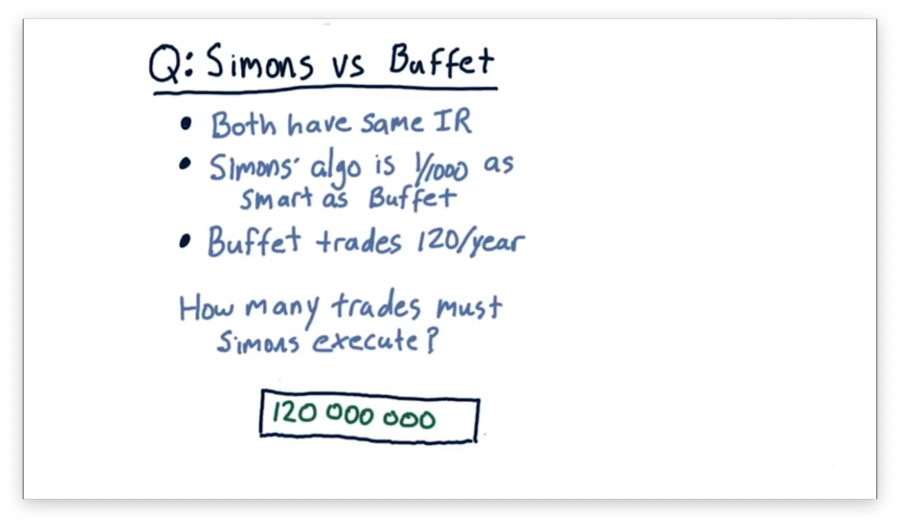
If Buffett trades only 120 times per year, Simons has to trade 120,000,000 times to match Buffett's performance.
Let's step through the math. Since Buffett and Simons both have the same information ratio, we can set the equation for equal to the equation for .
Furthermore, we know that Simons's IC is 1/1000th Buffett's IC.
We can manipulate this equation to isolate .
Since we know that , we can solve for .
Portfolio Optimization and the Efficient Frontier
Building a Portfolio Quiz
Let's consider the three following portfolios.
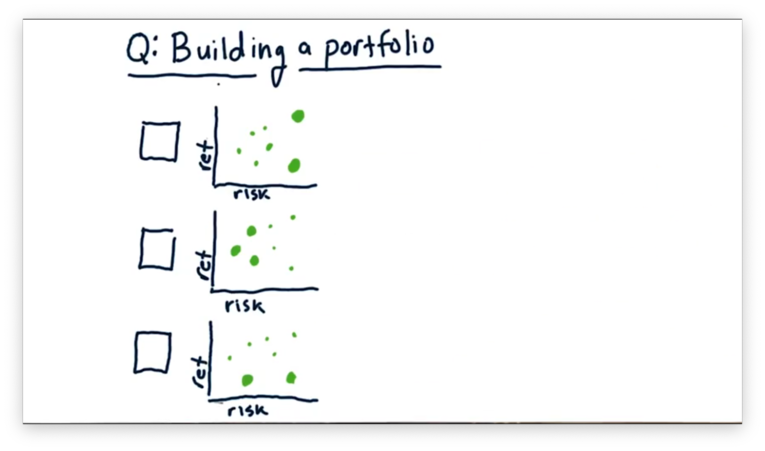
Each green dot represents an asset held in the portfolio, and the size of the dot represents the weight of that asset.
If we were to aggregate the risk and return of the individual stocks into one value, which of the following plots - in orange below - would match which portfolio?
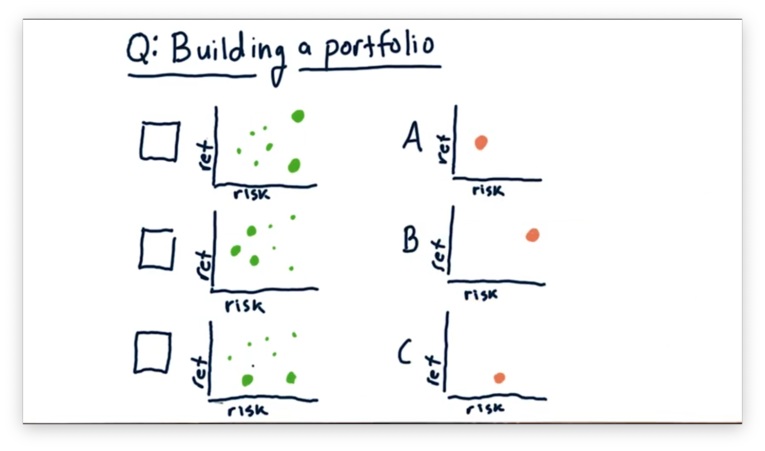
Building a Portfolio Quiz Solution

The first portfolio emphasizes two high-risk stocks: one with low return and one with high return. Of the three plots, B looks best-aligned for this allocation.
The second portfolio emphasizes three low-risk stocks with an aggregate middle-of-the-road return. Of the three plots, A looks best-aligned for this allocation.
Finally, the third portfolio emphasizes two low-return stocks: one with low risk and one with high risk. Of the three plots, C looks best-aligned for this allocation.
Reinforcement Learning
Trading as an RL Problem Quiz
We want to use reinforcement learning algorithms to trade; to do so, we have to translate the trading problem into a reinforcement learning problem.
Consider the following items. For each item, select whether the item corresponds to a component of the external state , an action we might take within the environment, or a reward that we might use to inform our policy .
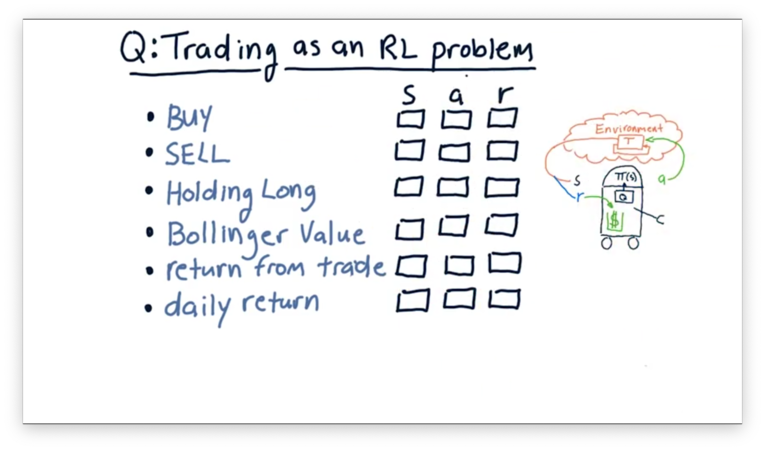
Trading as an RL Problem Quiz Solution
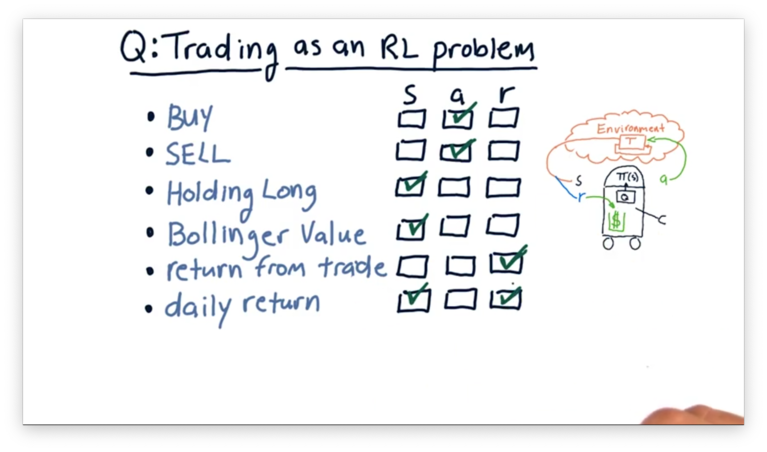
Buying and selling stock are both actions that we execute upon our environment.
Holding long and Bollinger value are both parts of the state. Holding long tells us about our position in a particular stock, and Bollinger value tells us about the current price characteristics of a stock. Both of these pieces of information might drive subsequent action.
The return from a trade is our reward. If our return is positive, so is our reward. On the other hand, a negative reward indicates that we lost money on the position. Daily return could be either a component of the state - a factor we consider before generating an action - but it could also be a reward.
Which Approach Gets $1M Quiz
Which of the following approaches leads our robot to a policy that causes it to reach the $1 million reward?
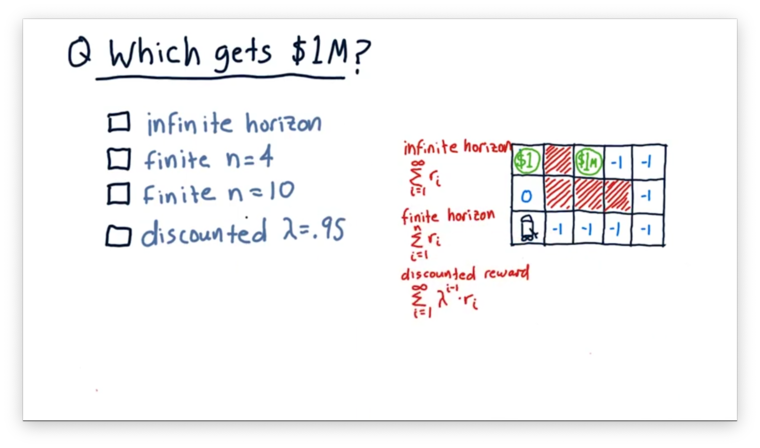
Which Approach Gets $1M Quiz Solution
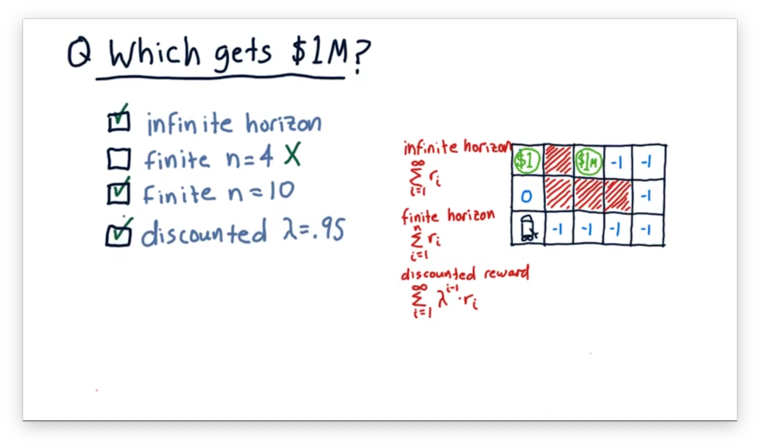
With an infinite horizon, the robot may exclusively grab the $1 ad infinitum, or it might first grab the $1 million before returning to the $1. As a result, obtaining the $1 million is possible with infinite horizon, but not guaranteed.
With a finite horizon of length four, the robot does not reach the $1 million. A journey towards the $1 million results in four penalties, whereas heading towards the $1 results in a positive reward. However, if we increase the horizon to ten, the robot does reach the $1 million.
In the discounted scenario, each reward in the future is successively devalued by 5%. Even so, the $1 million reward is so large that seeking this reward is still the optimal strategy.
Q-Learning
The Trading Problem: Rewards Quiz
The rewards that our learner reaps should relate in some way to the returns of our strategy. There are at least two different ways that we can think about rewards.
On the one hand, we can think about the reward for a position as the daily return of a stock held in our portfolio. On the other hand, we can think about the reward for a position being zero until we exit the position, at which point the reward is the cumulative return of that position.
Which of these approaches results in a faster convergence to the optimal policy?
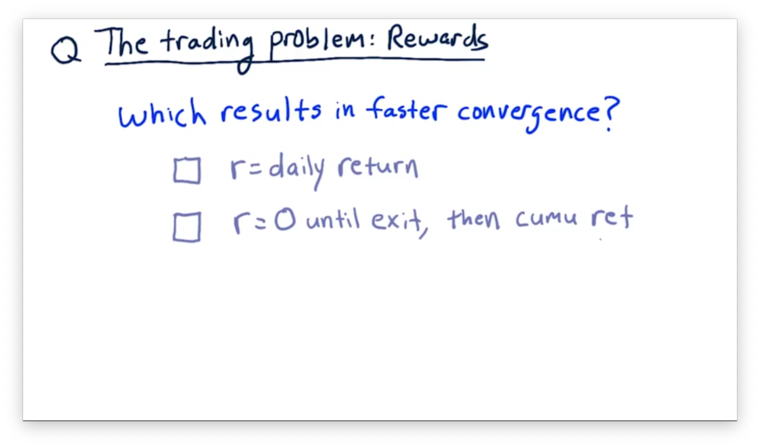
The Trading Problem: Rewards Quiz Solution
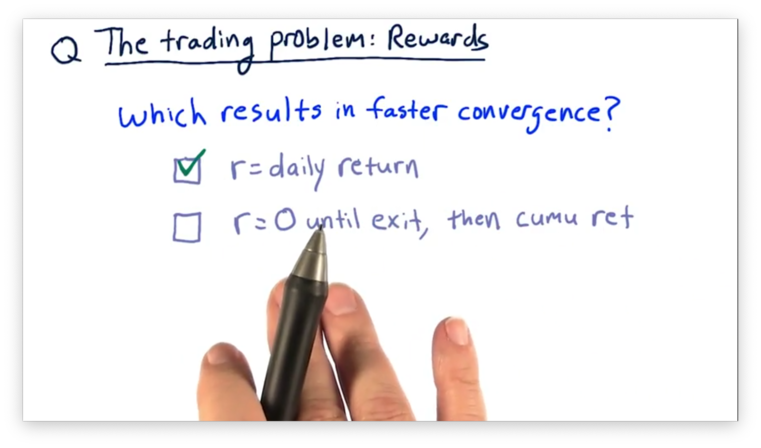
If we choose the delayed paradigm - where the reward is zero until the end of the trade cycle - the learner has to infer the correct sequence of actions leading up to the final action that brought about the large windfall. If we reward a little bit each day, however, the learner can learn much more quickly because it receives much more frequent rewards.
The Trading Problem: State Quiz
Consider the following factors and select which should be part of the state that we examine when selecting an appropriate action.
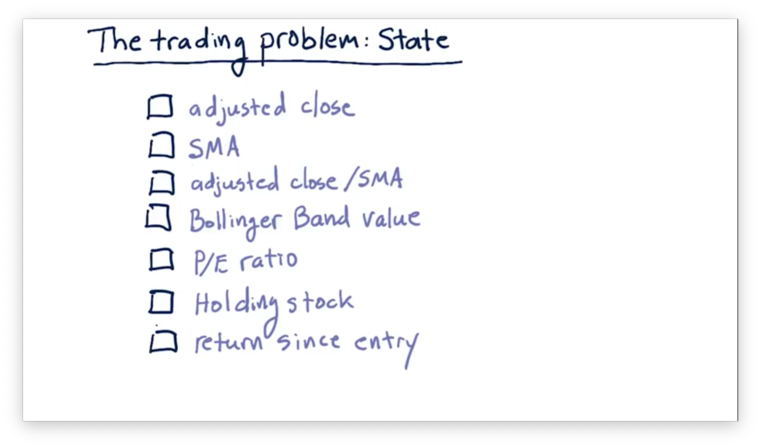
The Trading Problem: State Quiz Solution
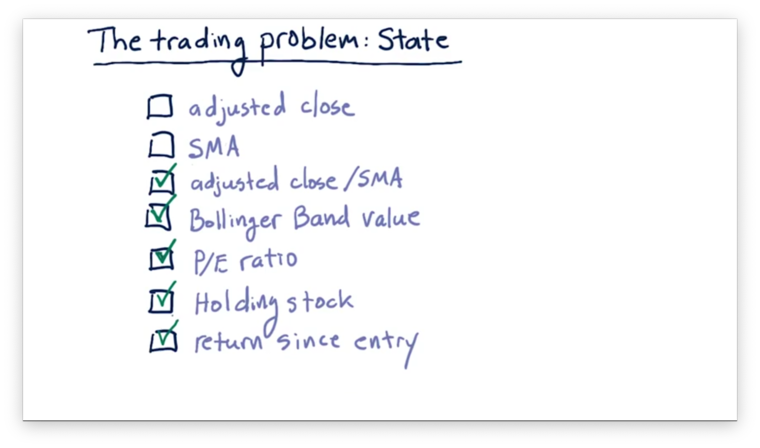
Neither adjusted close nor SMA alone are useful components of the state because they don't particularly mean much as absolute values. For example, if GOOG closes at $1000 per share, and XYZ closes at $5 per share, we cannot determine, based on that information alone, whether we should buy, sell, or hold either of those stocks.
However, the ratio of adjusted close to SMA can be a valuable piece of state. For example, a positive ratio indicates that the close is larger than the SMA, which may be a sell signal. Additionally, other technical and fundamental indicators such as Bollinger Bands and P/E ratio can be essential parts of our state.
Whether or not we are currently holding a stock that we are examining is an important piece of state. For example, if we are holding a stock, it might be advantageous to get rid of it. Alternatively, if we are not holding a stock, we may not want to sell because we don't want to enter a short position.
Finally, our return since we entered a position might be a piece of our state. For example, we might decide to sell off a particularly volatile stock after we have locked in some amount of return.
Dyna
How to Evaluate T Quiz
Assume we have been interacting with the real world for a while, and we would like to consult our model of . Can you write an equation for in terms of ?
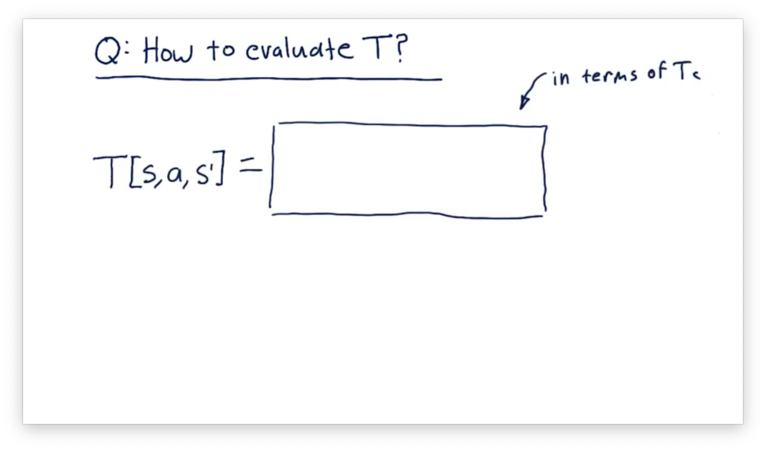
How to Evaluate T Quiz Solution
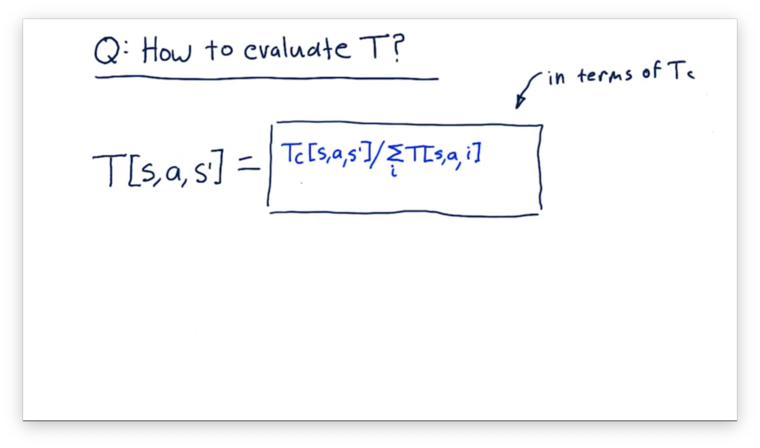
NOTE: The denominator in this equation should reference , not .
What we want to find here is the probability of a particular resulting state, , given a current state, and an action, . Thus, we need a fraction where the numerator is the number of transitions from to , by way of , and the denominator is the total number of transitions out of , by way of .
Let's consider the numerator first. The total number of transitions from to , as a result of , is simply the recorded value, .
Next, let's consider the denominator. The total number of times we transitioned out of by taking is the sum , where is the size of , the state space.
Altogether, we have the following equation:
OMSCS Notes is made with in NYC by Matt Schlenker.
Copyright © 2019-2023. All rights reserved.
privacy policy