Machine Learning Trading
Incomplete Data
4 minute read
Notice a tyop typo? Please submit an issue or open a PR.
Incomplete Data
Pristine Data
People have many misconceptions when it comes to financial data, and one of the biggest is that the data is always pristine. People often imagine that financial data is perfectly recorded, minute by minute, free of gaps and other errors.
That's just not the case.
For example, a stock might be traded on multiple exchanges - the New York Stock Exchange, the NASDAQ, and BATS, among others. At any particular minute during the day, it may trade at one price on one exchange, and a different price on another.
As a result, there is no single price for a stock at a particular time, and it's hard to say which exchange is "right" when it comes to pricing a stock. The reality of the data that we get is that it's often an amalgamation from several different sources, and different data providers supply different numbers.
Additionally, not all stocks trade every day, so we can see gaps in our data in between periods of activity. Additionally, stocks come into and go out of existence, so we might see data for a stock suddenly begin or end.
Why Data Goes Missing
Let's consider the following plot of SPY pricing data.
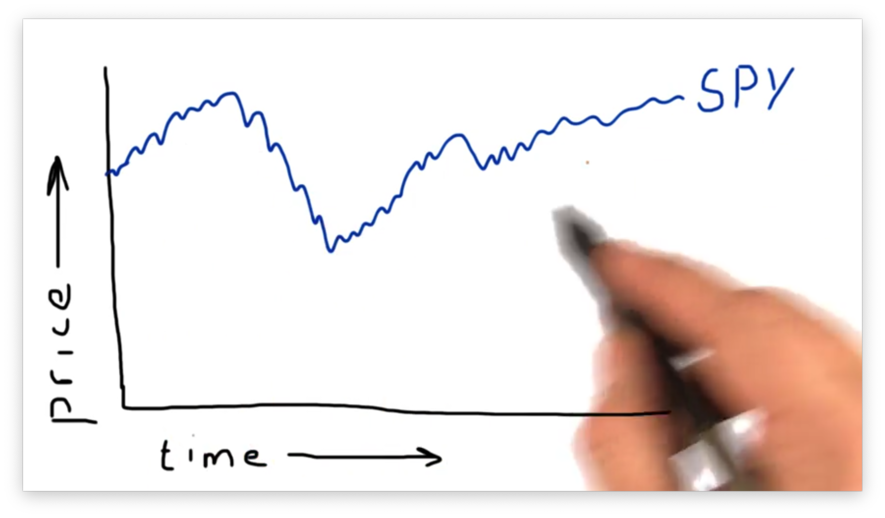
SPY, an ETF that tracks the S&P 500, is one of the most liquid and actively-traded ETFs on the market. Because of its frequent trading, we typically use SPY as a proxy for the stock market being open and as a time and date reference for other stocks.
Let's look at another stock: JAVA.
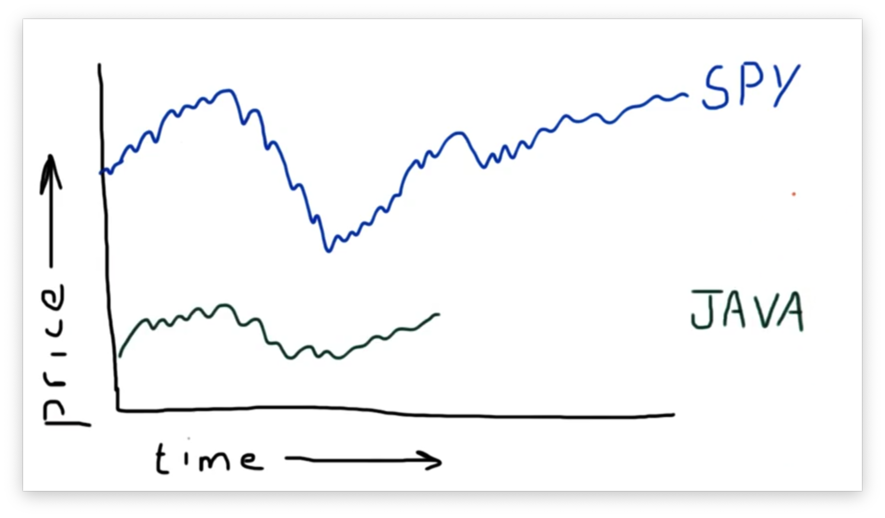
As we can see, JAVA was trading from the beginning of our time frame but then abruptly stopped. The reason for this is that Sun Microsystems, trading under the ticker JAVA, was acquired by Oracle in 2010. On that day, the JAVA ticker ceased to exist. From this date forward, all data for JAVA will be NaN.
Interestingly, before JAVA represented Sun Microsystems, it was the ticker for Mr. Coffee. If you look historically for data for JAVA, you'll find two different time series for the ticker: one for Mr. Coffee, and one for Sun Microsystems.
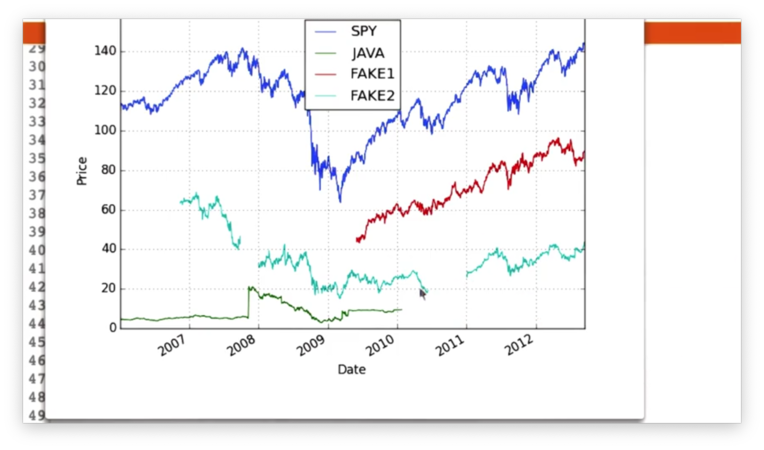
Let's look at another, admittedly fake, stock: FAKE1.
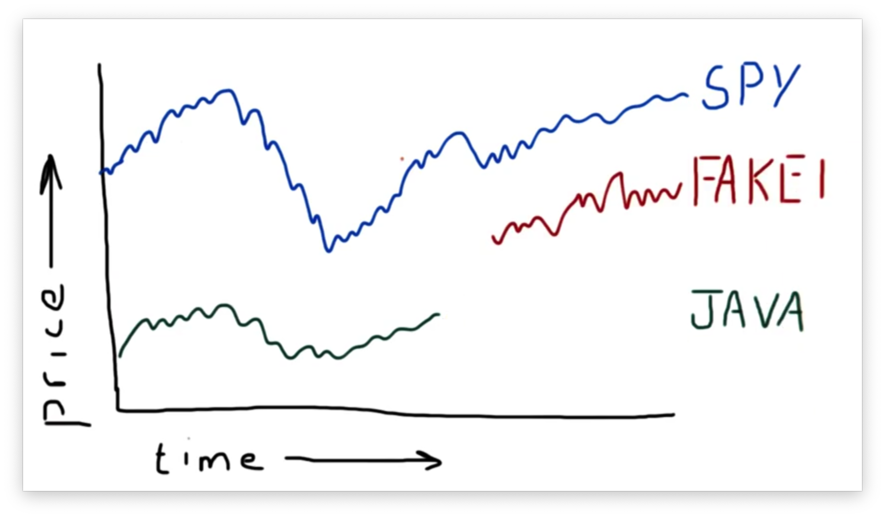
As you can see, FAKE1 didn't exist before a date roughly in the middle of our range. While we see NaN values after a particular date for JAVA, we see NaN values before a particular date for FAKE1.
Let's look at a second fake stock: FAKE2.
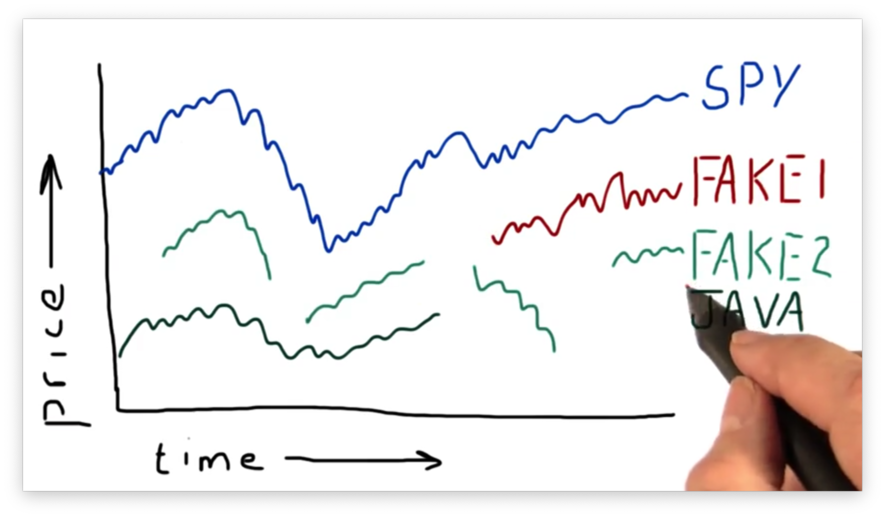
We can see that, in addition to not having data at the beginning of the range, FAKE2 also has serious gaps in the data throughout the range. This data is not typical for a very large, liquid stock like GOOG or APPL, but can be typical for thinly traded stocks, such as those that have a smaller market capitalization and trade infrequently.
Why this is Bad / What we can Do
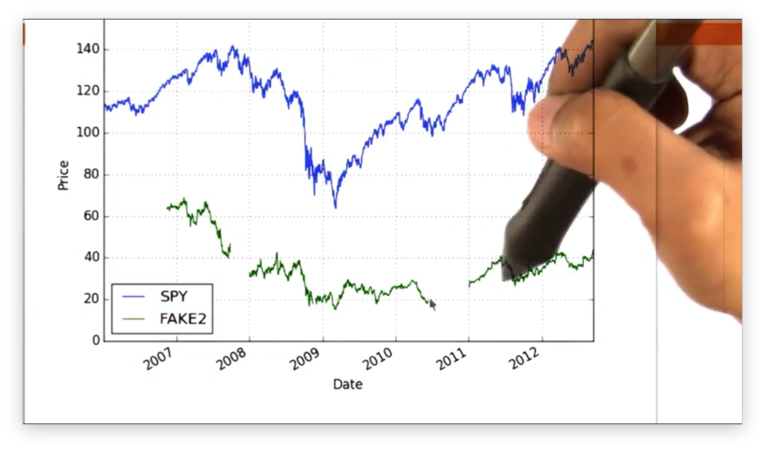
What do we do when we have significant gaps in our data? Let's take another look at our fake ticker FAKE2.
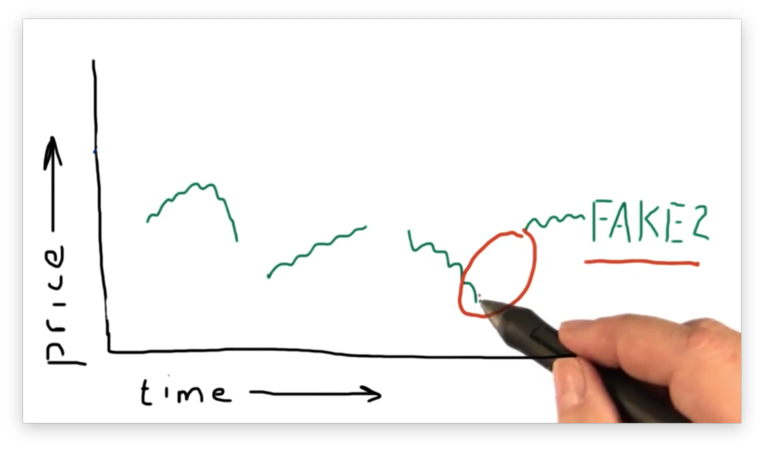
The truth of the matter is that, between the two points on either side of the gap, there simply was no trading; in other words, there was no price for this stock.
However, if we want to compute any sort of statistic over these gaps, we need to fill them with something because we can't run statistics of NaN values.
Our first thought might be to interpolate the data. That is, we could fill in the data between the two points on either side of the gap by drawing a line connecting them.
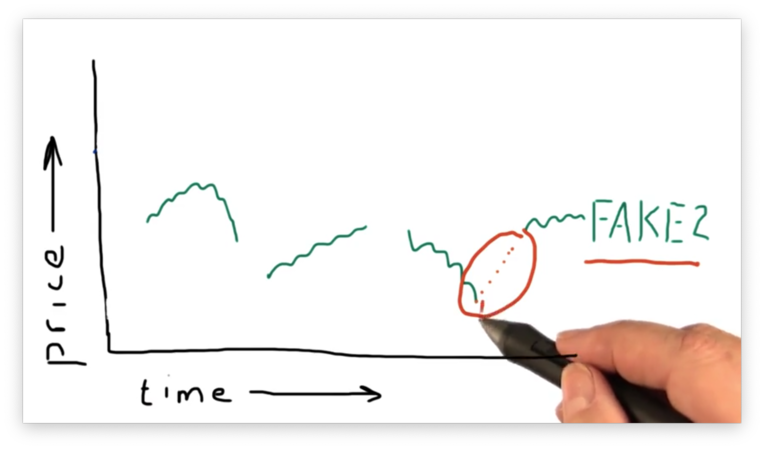
This is the wrong approach.
Suppose we were looking for patterns in the data, and we had rolled back time to step through the pricing data day by day. Let's suppose the current day we are examining is one of the points that we interpolated.
To interpolate the points in the gap, we had to know the points at the beginning and the end of the gap. However, from the perspective of any individual interpolated point, the end of the gap exists in the future.
As a result, we cannot consider any of the interpolated points without conceding that we necessarily baked information from the future (relative to the point) to bring about its existence. Since we can't peek into the future in real life, we cannot take this approach in simulation.
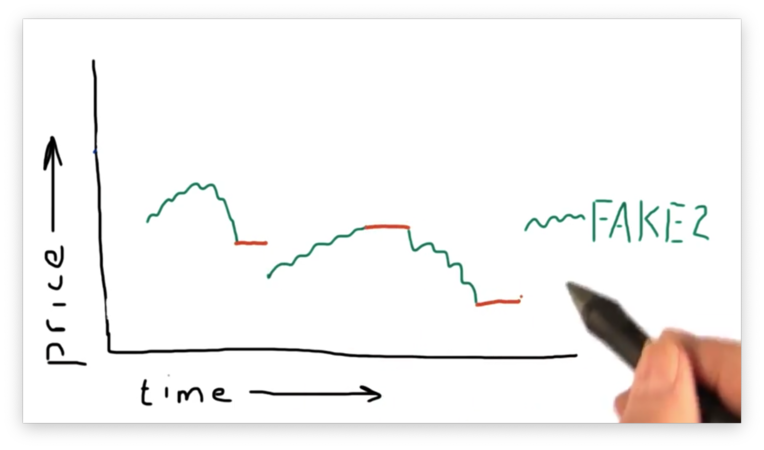
A better approach is the fill forward approach. In this approach, each data point in the gap is given the value of the last-seen data point.
However, we still have missing data at the beginning of our range. The first gap begins somewhere to the left of the y-axis, leaving us with no value from which to fill forward.
We need to fill in this gap, so we choose to fill backward from the first known price in this situation.
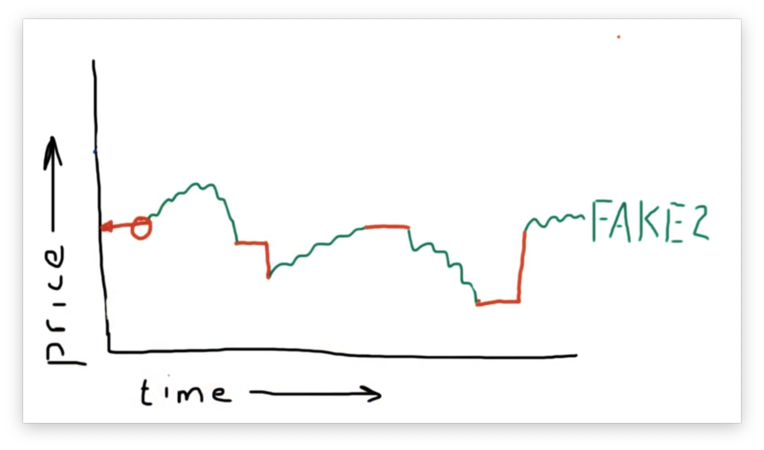
Generally, we fill forward first and fill backward second. This approach helps us avoid peeking into the future as much as possible.
Pandas fillna() Quiz

Our task is to find the parameter that we need to pass to fillna to fill forward missing values.
Pandas fillna() Quiz Solution

Documentation
Using fillna()
Let's take another look at the data for FAKE2.
We notice a gap in the data at the beginning of the date range, as well as several gaps in the middle.
Given a DataFrame df, we can forward fill missing values with the following method call:
df.fillna(method="ffill")Let's plot the FAKE2 prices again.
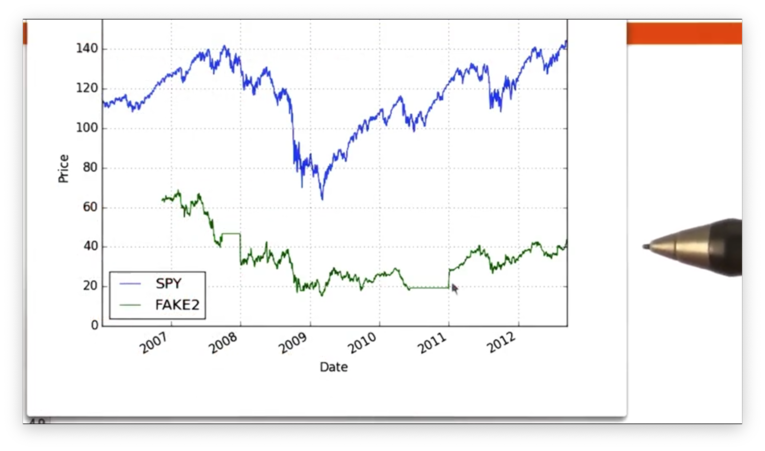
We can see the horizontal lines where we have forward filled the gaps in the data. However, we are still missing values at the beginning of the range.
Documentation
Fill Missing Values Quiz
If we look at the following plot of stock price data, we can see several gaps.
Our task is to use the fillna method to fill these gaps.
Fill Missing Values Solution
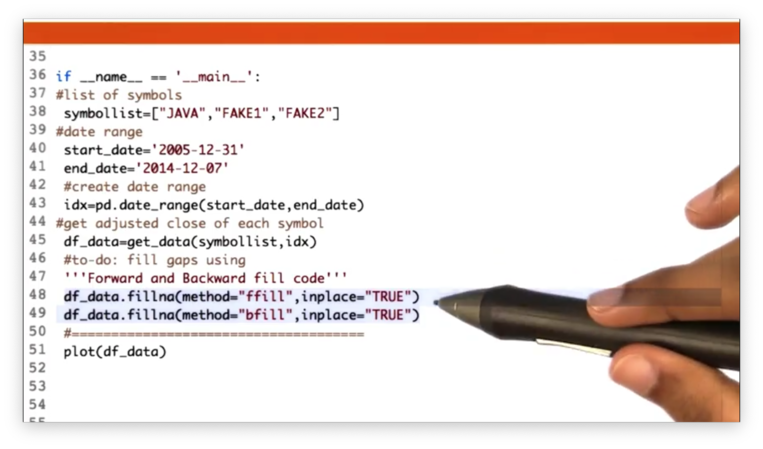
We can use forward filling for gaps that have a definitive start date, and backward filling for gaps that have no beginning or begin before our date range.
Documentation
OMSCS Notes is made with in NYC by Matt Schlenker.
Copyright © 2019-2023. All rights reserved.
privacy policy