Operating Systems
Thread Performance Considerations
22 minute read
Notice a tyop typo? Please submit an issue or open a PR.
Thread Performance Considerations
Which Threading Model Is Better?
Let's compare the following two models to see which one is better
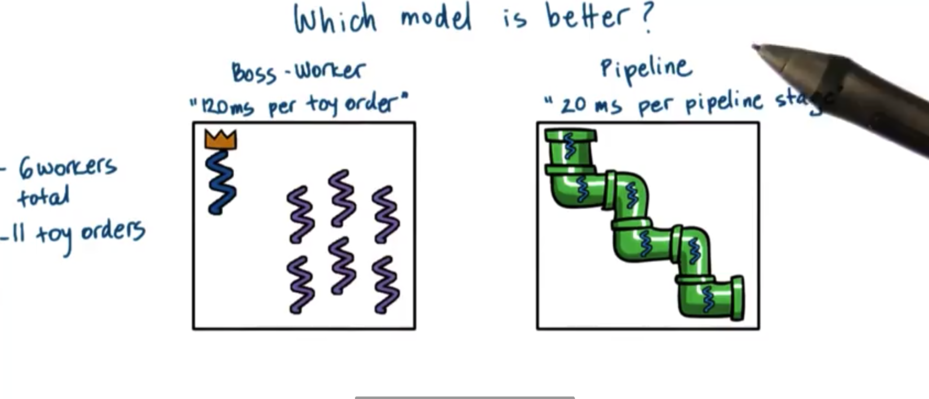
Regarding execution time, the boss/workers model took 360ms to complete 11 toy orders with 6 workers, while the pipeline model took 320ms with the same constraints. From the perspective of total execution time, the pipeline model performs better than the boss/workers model.
What about average time to complete an order?
For the boss/workers problem, the first five orders took 120ms to complete. The second five orders had to wait 120ms and then took 120ms to complete. The final order had to wait 240ms and then took 120ms to complete. Thus the average time per order was
total_orders = 11
total_time = (120 * 5) + (2 * 120 * 5) + (3 * 120)

average_time_per_order =  total_time / total_orders
# average_time_per_order approx 196ms
For the pipeline model, the first order took 120ms to complete. The second order waited 20ms for the first order to leave the first stage, and then took 120ms to complete. The third order waited 20ms on the first order, and 20ms on the second order, and then took 120ms to complete. Thus, the average time per order is
total_orders = 11
total_time = (1..total_orders).reduce(0) do |sum, order|
	 sum += 120  + (20 * order)
end

average_time_per_order =  total_time / total_orders
# average_time_per_order == 220ms
If execution time is important, pick the pipeline model. Rather, if we care about the average time to complete the order, the boss/workers model is better.
It's usually not possible to decree that one model is better than the other. Performance of a model is relative to the metric being measured, and different metrics may be important in different contexts.
Are Threads Useful?
Threads are useful for a few reasons. They allow us to have speed up because we can parallelize problems. We get to benefit from a hot cache because we can specialize what a particular thread is doing. Using threads leads to implementations that have lower memory requirements and are cheaper to synchronize than implementations that are multiprocess. Threads are useful even on a single CPU because they allow us to hide latency of I/O operations.
What is useful?
For a matrix multiply application, we may care about the raw execution time of the application. For a web server application, we might care about the throughput of the application (number of requests/time) or we might care about the response time. For a hardware chip, we might care about the overall utilization increase of the hardware.
For any of these metrics, we might care about the average value, or the max/min value, or maybe even the value at a certain percentage. For example, we may consider that an application that completes a task in 3ms 95% of the time to be sufficient.
To evaluate some solution, and determine whether it is useful or not, it is important to determine the properties that we really care about. We call such properties metrics.
Performance Metrics
A metric is a measurable or quantifiable property of a system that we are interested in that can be used to evaluate the system's behavior. For example, a metric can be the execution time (measurable property) of a software implementation to a problem (component of system we are interested in) which can be used to see if the implementation being analyzed is more performant than other implementations (system behavior evaluation).
So far, we have discussed many useful metrics, such as:
- execution time
- throughput
- request rate
- CPU utilization
There are many more.
For example, in some systems we may not care so much when we get an answer, but rather when our job will start executing. This is known as wait time. Often, we would like for the value of this metric to be low. We would like to wait as little as possible for our jobs to start executing.
Throughput helps us evaluate the utility of a platform; that is, how many tasks will the platform complete in a given unit of time. This can be evaluated in the context of a single server or as complex a system as an entire datacenter.
If I own the data center, throughput may not be the metric that I am exclusively interested in. I might also be interested in platform efficiency, which measures how well resources are utilized to in order to deliver a certain measure of throughput. This matters because I make money as a result of high throughput (completing work quickly), but I also spend money to maintain my platform. A higher measure of platform efficiency means I have to spend less on my platform.
If I really just care about money, I can look at performance per dollar. If I want to know if I should buy the next greatest hardware platform, I should examine whether that cost that I incur in doing so will be offset by a boost in performance per dollar.
Many times, I am more concerned about energy requirements. I might look at performance per watt when making decisions about new pieces of hardware. If my energy costs are high, maybe the right purchase is a machine that is more energy efficient.
When looking to incorporate enterprise software into the system, another useful metric may be the percentage of SLA violations. It may not make sense to create a contract with a software company if the SLA violations on their products are very high.
Some metrics are not super useful to maximize. For example, "smooth" video requires ~30fps. It doesn't make sense to maximize the fps, but rather the goal should be to stay above or around 30fps for some high percentage of the time. In this case client-perceived performance is the goal, not raw performance.
You may be interested in just one metric before making decisions, or you may need to aggregate metrics or even derive new metrics in order to accurately understand the system that you are evaluating.
In summary, a metric is some measurable quantity we can use to reason about the behavior of a system.
Ideally, we will obtain these measurements running real software on real machines with real workloads. Often, this is not feasible for many different reasons. In these cases, we may have to settle on "toy" experiments that are representative of realistic situations that we may encounter.
We refer to these experimental settings as a testbed. The testbed tells us where/how the experiments were carried out and what were the relevant metrics being gathered.
Really … Are Threads Useful?
There isn't really a straightforward answer to this question or the more general question of "Is X Useful?". The answer depends on which metrics we have gathered, as well as the workload on the system. For different combinations of these two variables, we may arrive at very different conclusions.
For example, some graph traversal algorithms work best on sparse graphs, while others work best on dense graphs. Some filesystems are optimized for read access, while others might be optimized for a write-heavy system.
The answer is: It depends! While, this answer is almost always correct, it is rarely accepted. What is more important perhaps, is to modify the question, extending it to include the context you wish to examine and the metrics you wish to obtain.
Multi Process Vs. Multi Threaded
An application can be implemented in a multithreaded way, which we have talked about at length. An application can also be implemented in a multiprocess way. Both strategies can be used to provide concurrency.
We will compare the multithreaded approach and the multiprocess approach in the context of a web server, which may like to utilize concurrency in order to more efficiently process client requests.
Steps in a web server response flow
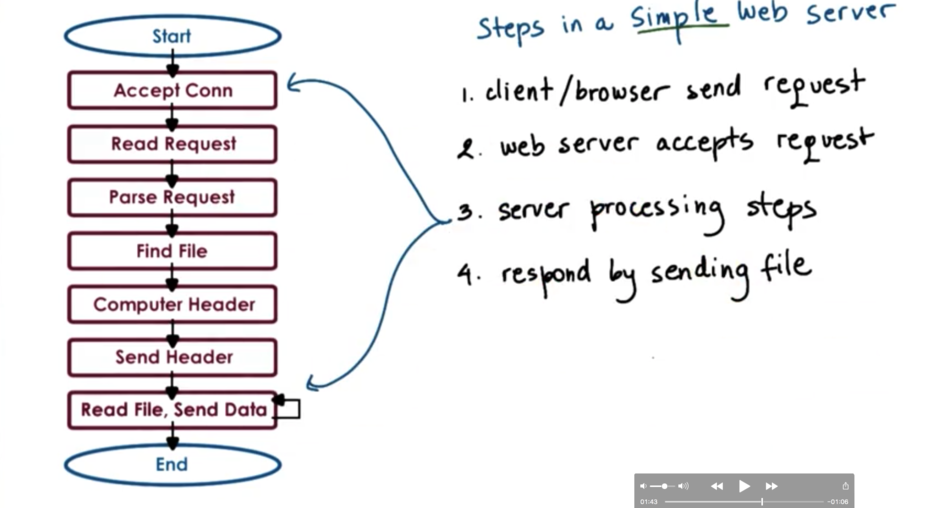
Some of these steps are more computationally expensive, so most of the work will be done by the CPU. The request parsing step and header creation steps are good examples of this.
Other steps require interaction with the network, like accepting a connection and sending the data.
Still other steps require interaction with disk, such as finding and reading the file.
Multi Process Web Server
One easy way to achieve concurrency is to have multiple instances of the same process.
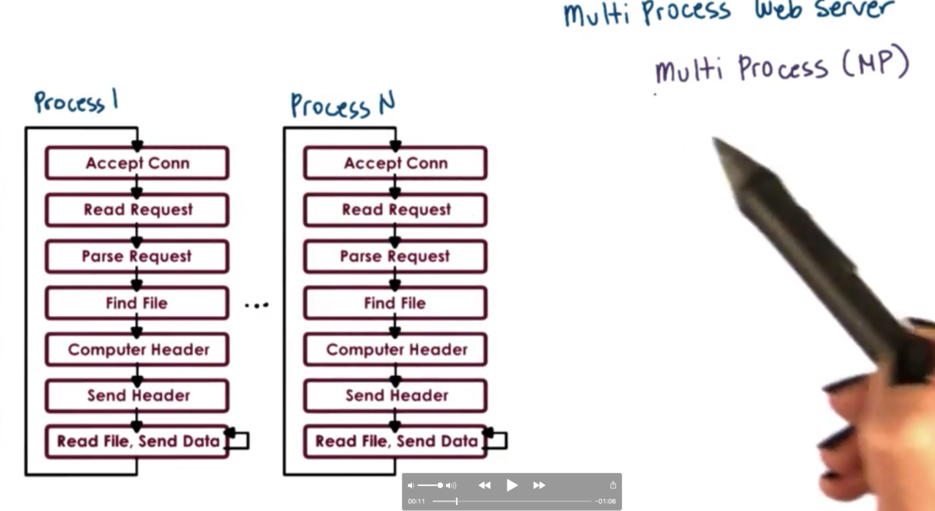
The benefits of this approach is that it is simple. Once we have correctly developed the application, we can just spawn multiple processes and run it in each process.
The downside of running multiple processes in a platform is that there is a higher memory footprint, which can hurt performance. In addition, we have to pay the high cost of a context switch whenever we want to run a different process. As well as, it can be hard/costly to maintain shared state across processes due to IPC constraints. Finally, it may be difficult to have multiple processes listening on a specific port.
Multi Threaded Web Server
Instead of taking a multiprocess approach, we can opt for a multithreaded approach, achieving concurrency within a single address space.
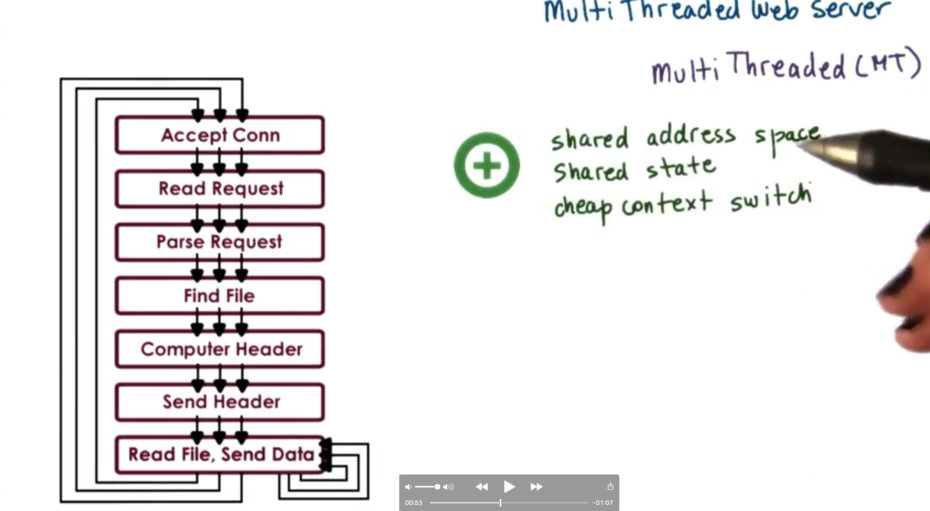
In this diagram, every thread is performing all of the steps. Of course, we could have a boss/workers setup where the boss runs the first step and the workers execute the remaining steps. We could also have a pipeline setup, in which multiple threads execute one step and one step only.
The benefits of this approach are that we have a shared address space, shared state, and a cheap user level context switch. Memory requirements are lighter, since we have a lot of shared information across all threads in the process.
The downside of this approach is that it is not a simple implementation. Multithreaded programs require explicit application level synchronization code, which can add to the overall complexity of the application. In addition, a multithreaded approach depends on underlying operating system level support for threads, although this is less of an issue now than it was in the past.
Event-Driven Model
An event driven application is implemented in a single address space, with a single thread of control. The main part of the process is an event dispatcher which in a loop looks for incoming events and then based on those events invokes one or more of the registered handlers.
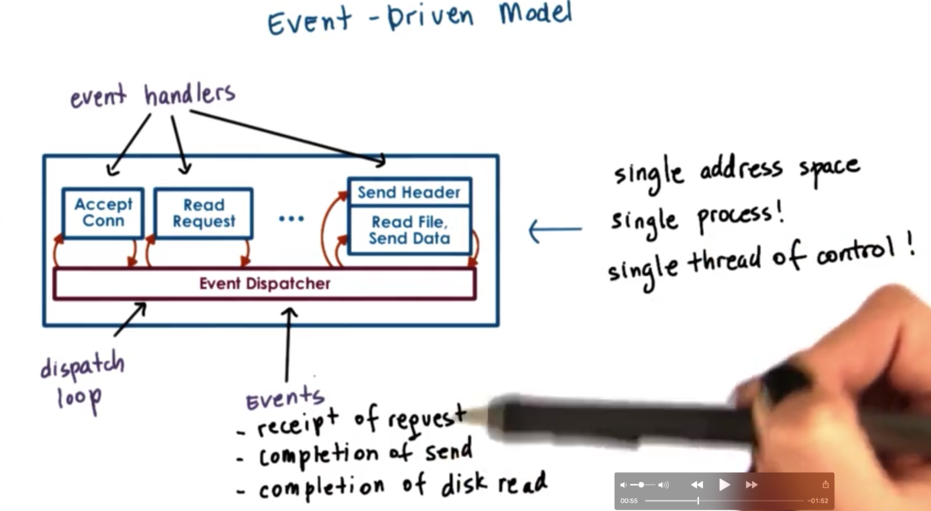
Events (in the case of a web server application) can correspond to:
- receipt of request
- completion of send
- completion a disk read
The event dispatcher has the ability to accept any of these types of notifications and based on the notification type invoke the right handler. Since we are talking about a single threaded process, invoking a handler is just calling a function, so we just jump our execution to that instruction within the process's address space.
The handlers run to completion. If the handler needs to block (by making an I/O request for instance), the handler will initiate the blocking operation and immediately pass control back to the dispatch loop.
Concurrency In The Event-Driven Model
In the multiprocess and multithreaded implementation, one request is handled at a time per execution context. Since we have multiple execution contexts, we can achieve concurrency.
In the event driven model, the processing of multiple requests are interleaved within a single execution context.
Let's say we have one client that makes a request to our server. The client connection is accepted, and the request is parsed by the server. At some point the server may block on trying to send some information back to the client. In the meantime, two more requests come in. The first of these requests is blocking on the receipt of the HTTP message from the client. The second of these requests is blocking on accepting the connection from the client. At some point later on, the processing for each of these requests will have advanced.
Even though we are within one thread of execution, we are still able to simultaneously parse multiple requests.
Event-Driven Model: Why?
What is the benefit of having a execution context processing multiple requests?
On a single CPU, threads can be useful because they hide latency. If the amount of time a thread will spend idle is greater than the time it takes to context switch twice, it makes sense to context switch and let some other thread do some work.
If there really isn't any idle time, context switching just wastes cycles that could have been used for request processing.
In the event driven model, a request will be processed exactly until a wait is necessary, at which point the execution context will switch to servicing another request.
If we have multiple CPUs, the event driven model still makes sense, especially when we have to service more concurrent requests than we have CPUs. Each CPU could host a single event-driven process, and multiple requests could be worked on concurrently within that process. This can be done with less overhead than if each CPU had to context switch among multiple processes or multiple threads.
Gotcha: It is important to have mechanisms that will steer the right set of events to the right CPU.
Event-Driven Model: How?
At the lowest level, we need to be receiving some events from the hardware, be it the network or the disk or some other hardware component. The operating system uses sockets as an abstraction over the network, and files as an abstraction over the disk.
Both sockets and files are represented by file descriptors. An event in the context of the web server is an input on any of the file descriptors associated with it.
To determine which file descriptor has input, we can use the select system call. This call takes a range of file descriptors and returns the first descriptor that has some input on it. Another alternative is the poll system call.
Both of these system calls have to scan through a potentially large list of file descriptors, and it is likely that there are only few within that list, which are allocated to our web server.
A more recent system call is epoll. This eliminates some of the problems that select and poll have, namely with scanning large lists of mostly useless file descriptors.
The benefits of the event driven model mainly come from the design as a single address space with a single flow of control. As a result, the overheads are lower. There is a smaller memory footprint, and no need for context switching or synchronization.
Helper Threads And Processes
When we talked about the many-to-one user level thread to kernel level thread model, we saw that a user level thread that blocks will block the entire process.
A similar problem can occur in the event driven model. If one of the handlers initiates a blocking call, the entire process can be blocked.
One way to circumvent this issue is to use asynchronous I/O operations. In asynchronous system calls the operating system obtains all of the relevant information from the stack, and either learns where to return results, or tells the caller where to get results later. Asynchronous calls let the process or thread continue execution now and check their results later.
Asynchronous calls require a multithreaded kernel. While the caller thread continues execution, another kernel thread must do all the waiting that is needed to get the I/O results. Asynchronous operations can also benefit from the hardware devices. For example, a thread can pass a request over to a device and the device can let the calling thread know at a later time the results of its request.
The takeaway is that when we perform asynchronous I/O operations, our thread will not be blocked in the kernel while the I/O operation actually takes place.
Asynchronous I/O operations fit nicely with the event-driven model.
Asynchronous I/O calls are not available on all platforms or for all types of devices. When these calls are not available, we need helpers.
When the handler needs to initiate an I/O operation that can block, the handler passes the call to the operation to a helper, and returns to the event dispatcher. The helper will be the one that handles the blocking I/O operation and interact with the dispatcher as necessary.
The communication with the helper can be with sockets or pipes, which both present a file descriptor like interface, which means that select and poll still work.
In doing this, the synchronous I/O call is handled by the helper. The helper will block, but the main event loop will not! Although we don't have asynchronous system calls, we can fake it to an extent by delegating blocking calls to processes.
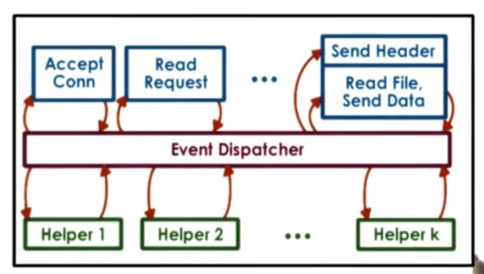
If the kernel is not multithreaded - it wasn't back in the day - the helpers need to be processes. The model was called the Asymmetric Multi-Process Event-Driven Model or AMPED. The multithreaded equivalent acronym is AMTED.
The key benefits of this model are that it resolves some of the portability issues of the basic event-driven model. That is, it fakes asynchronous I/O operations instead of relying on native support for them.
In addition, this model allows us to have a smaller footprint than a pure multiprocess or multithreaded model. Since a thread or a process in the pure multiprocess/threaded model needs to perform all of the steps for processing the request, the memory footprint will be higher than that of a helper that just needs to do a very isolated task.
One downside is that this model is only applicable to certain classes of applications. Another downside is that there are some complexities surrounding event routing on multi CPU systems.
Flash Web Server
Flash is an event-driven web server that follows the AMPED model, which means it has asymmetric helper processes to help with blocking I/O operations.
The blocking I/O operations that are happening in this scenario are basically just disk reads.
The communication from the helpers to the event dispatcher is performed via pipes. The helper reads the file in memory via mmap and then the dispatcher checks via mincore to see if the pages are in memory, and uses this information to determine if it should call a local handler or a helper. As long as the file is in memory, reading it will not result in the blocking I/O operation, which means that the local handler can be used.
Flash performs application level caching at multiple levels.
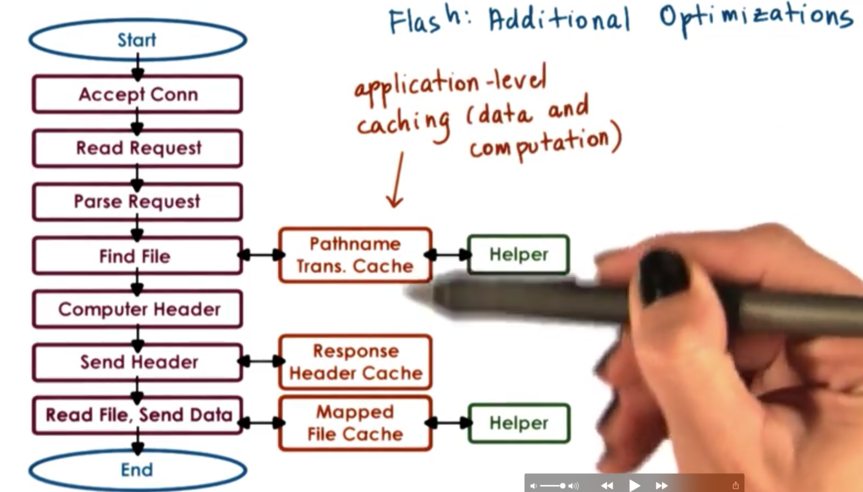
It does this on both data and computation. It is common to cache files: this is data caching. Computation can also be cached. For instance, every request has an associated pathname, and we need to look up the file given the pathname. That lookup will compute some result, which we can cache so we do not have to perform the same computation again.
Similarly, the fields in the HTTP header are often file dependent. So long as the file doesn't change, the headers don't need to change. Thus we can cache the response header so long as we can tell that the file hasn't changed. Again, we don't need to perform an unnecessary computation.
Flash also makes some optimizations that take advantage of the available network hardware.
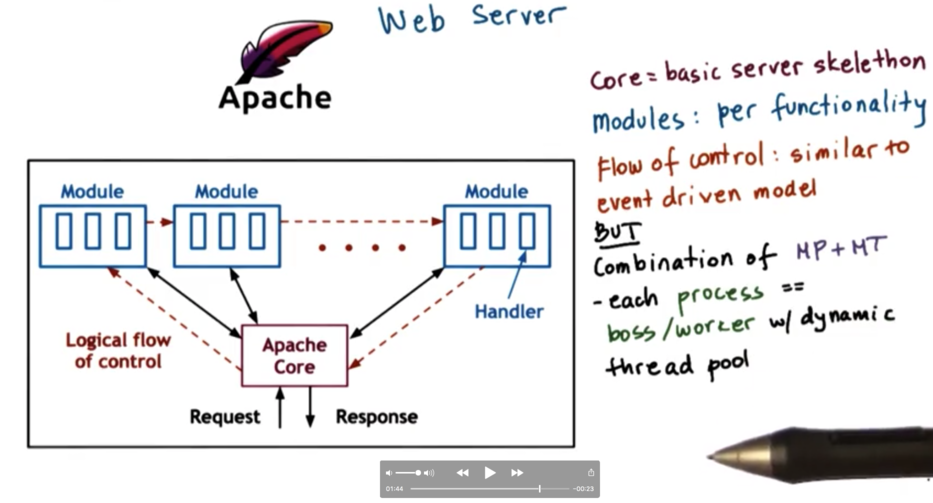
Apache Web Server
The core component of the apache web server provides the core server functionality. This includes accepting requests, issuing responses, and managing concurrency. The various modules are mounted in a pipeline and extend the functionality of the basic server behavior. A specific apache deployment may contain one or more modules.
The flow of control is similar to the event driven model in that each request passes through all the modules, similar to how the request passed through all the handlers.
Apache is a combination of a multiprocess and multithreaded model. In apache, each instance is a process, which implements a multithreaded boss/workers configuration with a dynamic thread pool. The total number of processes can also be dynamically adjusted depending on - among other factors - the number of outstanding requests/pending connections.
Experimental Methodology
The experiments outlined in the flash paper are designed such that the results can help the authors of their paper back up the claims they made about flash.
To achieve a good experimental design you need to answer a few questions.
What systems are you comparing? Are you comparing two software implementations? If so, keep the hardware the same. Are you comparing two hardware platforms? Make sure the software is consistent.
What workloads will you use? What are the inputs on the system? Will you be able to use data that may be expected/gathered from the real world, or will dummy data be used?
Finally, how will you measure performance? Will you look at execution time, throughput or something else? Who are you designing the system for?
What systems are you comparing?
The authors compared their implementation against
- a multiprocess, single threaded implementation
- a multithreaded implementation using the boss/workers pattern
- a single process event-driven (SPED) implementation
- Zeus (SPED implementation with two processes)
- Apache (multiprocess at the time)
What workloads will be used?
They wanted workloads that represented a realistic sequence of requests, because that is what will capture a distribution of web page accesses, but they wanted to be able to reproduce the experiment with the same pattern of accesses. To accomplish this, they gathered traces from real web servers, and replayed those traces to their systems.
They used two real-world traces. The first trace was the CS WebServer trace, which represents the Rice University web server for the computer science department, which includes a large number of files and doesn't really fit in memory. The second trace was the Owlnet trace, which was from a web server that hosted a number of student run websites and it was much smaller so it would typically fit in the memory of a common server.
In addition to these real traces, they also used a synthetic workload generator. Since they couldn't replay synthetic workloads, they instead performed some best/worst analysis when looking at performance with these workloads.
How will you measure performance?
A common metric to measure web servers - that was used in this paper - is bandwidth. Bandwidth measures the total number of bytes transferred divided by the total amount of time it takes to transfer those bytes.
Second, because the authors were concerned with Flash's ability to perform concurrent processing, they wanted to see the impact of connection rate as a metric. This is defined as the total number of client connections serviced divided by the total amount of time that passed.
Both of these metrics were evaluated as a function of file size. The intuition is that with a larger file size, the connection cost can be ammortized, resulting in higher bandwidth. On the other hand, with a larger file size, there is more work to do per connection, so it's expected that there will be a lower connection rate.
Experimental Results
Let's look at the experimental results.
Best Case Numbers
For the best case, the authors used the synthetic load. They varied the number of requests that were made, but made sure each request asked for the exact same file. The is the best case because once the file is requested once, it can be cached which means that subsequent requests for the file will be answered much more quickly.
For the best case experiment, they vary the file size from 0 to 200kb, and they measure the bandwidth which is the number of requests times the file size divided by the total time. By varying the file size, they vary the amount of work that the server has to do on a given request.
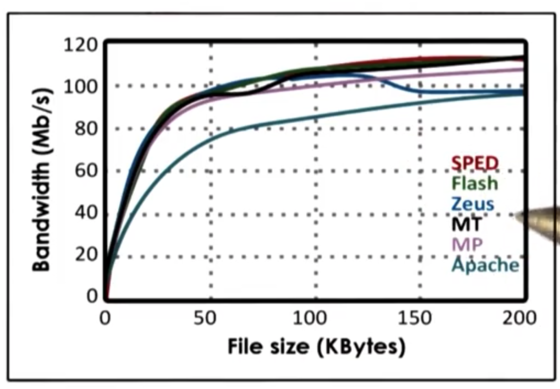
All of the implementations had similar results, with bandwidth increasing sharply with file size initially before plateauing.
SPED has the best performance. Flash is similar in performance, but it performs the extra check for memory presence. Zeus has an anomaly, where it drops in performance after a threshold of around 125Kb. The performance of the multithreaded/multiprocess implementations are lower because of the extra synchronization requirements and the cost of context switching. Apache has the lowest performance because it has no optimizations.
Owlnet Trace
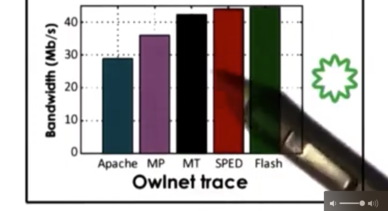
For the Owlnet trace, the results are mostly similar to the best case. We can see that Flash and SPED are the best, followed by MT/MP and then Apache. The reason for this trend is because the owl trace is very small, so most of the requests can be serviced from the cache. However, not everything can be serviced from cache, so sometimes blocking I/O is required. In this case, SPED will block, but Flash will not because it has helpers. This helps explain why Flash's performance is slightly higher than the SPED implementation.
CS Trace
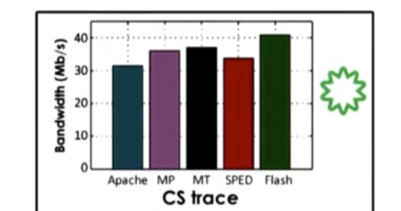
The CS trace is a much larger trace, which means that most requests are not serviced from the cache. Since the SPED implementation does not support asynchronous I/O the performance drops significantly. The multithreaded implementation does better than the multiprocess implementation because it has a smaller memory footprint (more memory available to cache files) and is able to synchronize more quickly/cheaply.
Flash performs the best. It has the smallest memory footprint, which means it has the most memory available for caching files. As a result, fewer requests will require blocking I/O requests, which further speeds everything up. In addition, since everything occurs in the same address space, there is no need for explicit synchronization.
Impact of Optimizations
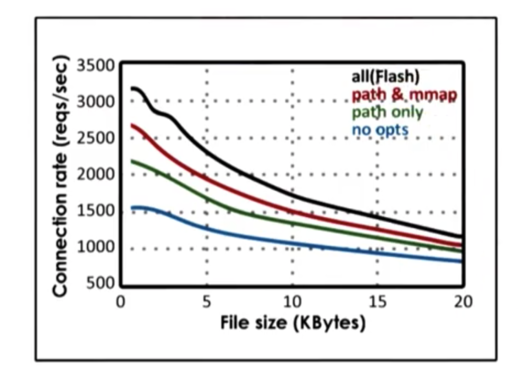
We can see that in all cases, connection rate decreases with file size. That being said, connection rate increases as the number of optimizations increase, with the fully optimized flash having the highest connection rate at a given file size. Optimizations are important!
Summary of Performance Results
When the data is in cache, SPED smokes AMPED Flash, since AMPED Flash makes an "unnecessary" test for memory presence on each request. Both SPED and AMPED Flash perform better than MT/MP models, because neither occurs any synchronization or context switching overhead.
When the workload is disk-bound, AMPED Flash performs much better than SPED, which blocks on I/O request because it doesn't have asynchronous I/O. AMPED Flash performs better than MT/MP because the more efficient memory implementation leaves more memory available for caching.
Advice on Designing Experiments
The clients using the web server care about the response time: how quickly they get a response. The operators of the web server care about throughput: how much information can they send as quickly as possible.
The efficacy of a solution will depend on whose problem you are trying to solve. You will likely need to justify your solution within the context of the problems that your stakeholders are experiencing.
For example, a solution may improve response time and throughput, or it may improve response time while keeping throughput constant, or it may improve response time while degrading throughput. Any of these solutions may be viable, depending on the context.
By understanding the stakeholders and the goals that these stakeholders are trying to meet, we can gain some insight into both the metrics and the configuration our experiments.
When picking metrics, a good rule of thumb is to start by looking at metrics that are standard for the target domain. For instance, for web servers it is common to talk about the client request rate or the server response time. This allows you to have a broader audience who can understand and interpret your results, and should be included even if they do not give the best punchline.
In addition, you need metrics that answer the who/what/why questions. Why are you doing this work? Whose problems are you trying to solve?
Once you understand the metrics you will be analyzing, it's important to understand system factors that affect those metrics.
For example, system resources can greatly affect metrics. Systems with different CPUs and memory configurations, running different software will often have wildly different results.
It's important to also consider the workload configuration. For a web server, we can vary the request rate, the number of concurrent requests, the file size, the access pattern and many more.
Once you have more insight into the configuration space available to your experiment, you need to actually pick some subset of features. It may be the case that the best approach involves variable ranges for some of the configuration parameters. Try to make these ranges realistic. Don't use 1, 2 or 3 threads when real world setups use hundreds of threads.
It is possible to engineer configurations such that you can provide best/worst analysis about the system that you are analyzing. In this case, it may be okay to have configurations that, while not common, are still possible.
Compare apples to apples! Put another way, only vary one parameter at a time! Don't vary the workload and the software; how will you be able to tell which factor influenced your results?
What is the baseline performance of the system you are improving? You want to be able to show that your experiment somehow improves the state of the art or at least improves the most common configuration/workflow.
Advice on Running Experiments
Here is the easy part:
- Run test cases N times
- Compute metrics
- Represent results
Make sure to not just show results. Draw a conclusion! Spell out what the results say about the hypothesis or the claim that you are presenting.
OMSCS Notes is made with in NYC by Matt Schlenker.
Copyright © 2019-2023. All rights reserved.
privacy policy